
Most indicators signal the upcoming trend reversal, and others show that the market is consolidating, but today we will speak about an indicator with a kind of ambiguous reputation. Its name is the harami candlestick pattern.
Although the educational articles about trading will tell you that the harami pattern is a trend reversal signal, for many traders, the bearish and bullish harami candles mean a moment of uncertainty in the market. Some traders even tend to ignore them. However, there are some signals you can retrieve from the harami pattern. Read this article to learn how to use the harami candlestick pattern.
What Is the Harami Candlestick Pattern?
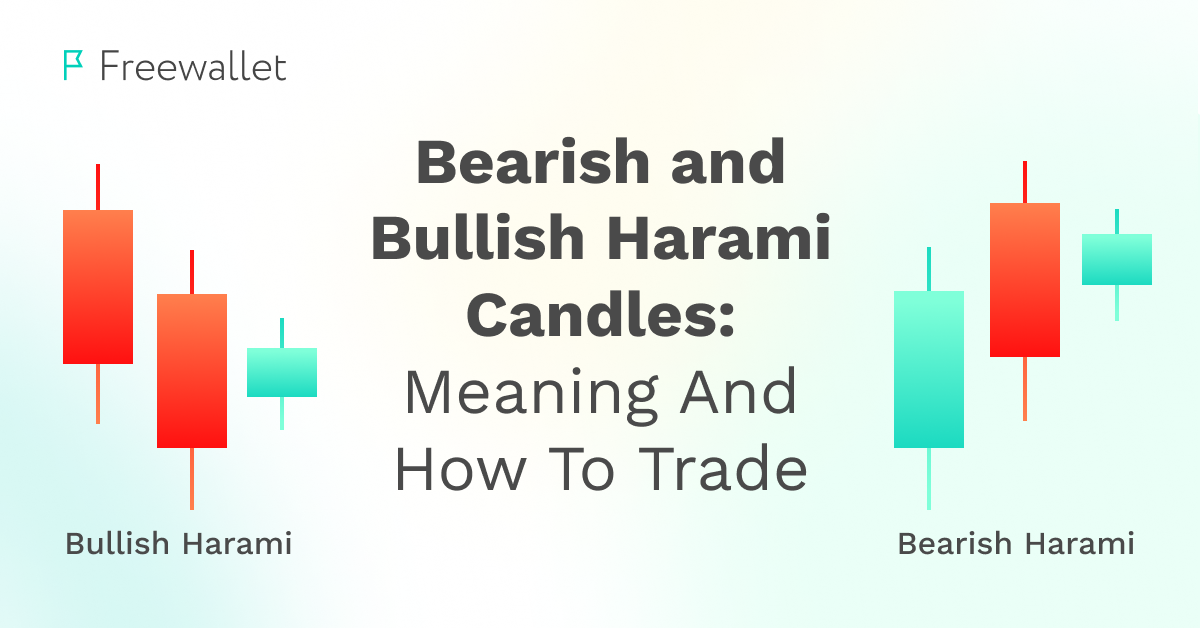
The harami candlestick is a trading pattern consisting of two candles, a big candle followed by a much shorter one. The big candle’s body overlaps the wicks of the short one. The green candle followed by the red one is a bearish harami pattern, while the red candle followed by the green one is bullish. The name of this pattern is a Japanese word for “pregnant.” Such a name is associated with the big candle “giving birth” to a small one.
There are different opinions over the purpose of the harami candlestick pattern. Some read it as a trend reversal signal, while others don’t see it as a clear signal and prefer to wait for later developments or use other indicators to figure out how to act. Below, you can see how to identify the harami pattern on a trading chart.
Candlestick Charts
To understand the harami patterns, you must have a good idea about the Japanese candlestick chart structure. Japanese candlestick charts are the default feature on most popular crypto exchanges. You can replace them with bars or other types of charts, though. Like many other crypto trading interface elements, candlestick charts came from stock markets.
Candlestick charts are convenient as they clearly indicate several stats in a simplistic form. The chart uses a horizontal timeline and a vertical price scale. The “candlesticks” themselves indicate the trend in a given amount of time: green candles mean that the price is moving upwards, and red candles stand for the downtrend movement.
Normally candles have upper and bottom wicks (vertical lines) and bodies (colored zone). The wicks indicate the price extremes at the given time frame. The upper point is the highest price, while the bottom end is the lowest price. The vertical borders of the body stand for the open and the close prices. If the open price is lower than the close price, the candle is green, and vice versa.
The candlestick chart structure allows traders to use numerous technical indicators and predict the upcoming changes to the price. The harami pattern is one of many popular indicators used with candlestick charts.
Identifying Bullish and Bearish Harami on a Trading Chart
In stock trading, each candle is associated with a specific day. This border in crypto is not straightforward, as crypto markets are 24/7. In stock trading, the harami pattern formation takes two days. The first day forms a huge body candle, meaning intensive trading with a significant interval between the extremes. The second day is characterized by much lower trading activity. Even the wicks zone doesn’t exceed the numbers related to the previous candle’s body. In crypto trading, the upper level of these candles can coincide, while in stock markets, the harami pattern is characterized by a gap between the upper-level prices of the candles.
The bearish harami pattern starts in the uptrend with a tall green candle followed by a short red candle. In contrast, the bullish harami pattern begins in the downtrend with a large red candlestick followed by a little green one.
As the structure of this pattern is so simple and frequent, you can spot harami quite often. Identifying it is not a challenging task. The more complex problem is to find the best interpretation of this pattern.
How to Trade with the Harami Candlestick?
The bearish harami pattern forms at the end of the uptrend. Some traders prefer to short their funds when the second candle, short and red, occurs as they read the occurrence of the second candle as a strong bearish signal, meaning that a return to a previous high level is barely possible in the nearest future. Selling at this point is regarded as quite a safe move.
If you spot the harami pattern at the end of the downward chart line, it is a bullish harami signal. The second candle opens at a significantly higher position than the previous candle. If you already see a green candle, the best moment to buy an asset is behind. However, some traders buy at this point expecting the continuation of the bull run.
In general, harami candles are not that definite. Many traders see the occurrence of harami candles as a point of uncertainty rather than a clear bullish, or bearish signal. Harami can be a precursor of the developing new trend. Traders consider it but wait for the following developments instead of performing immediate trades.
Regardless if you use the harami pattern as a trend reversal signal or just as a sign of uncertainty, it’s better to confirm your predictions with other indicators. If you rely on a single analysis tool, you may lose money, as any indicator has only relative accuracy. The best indicators have a somewhat 1:2 risk-to-reward ratio.
Harami Cross vs. Doji Candle
One of the harami pattern variations is called the “harami cross.” It occurs when the second candle appears to be entirely empty. The level of this “cross” continues the trend presented by previous candles. The candle with wicks but without the body signals the drastic market activity drop. The harami cross means that the trend reversal is about to hit. The probability is not 100%, though.
The harami cross pattern can be easily confused for a star Doji (or a Doji candle), which is a different indicator. A Doji candlestick is not signaling a trend change or something like that. It is just a sign of the uncertainty on the market as star Doji doesn’t have any elements except the hollow body candle itself. The harami cross is different because it has two candles, meaning that this pattern indicates a trend direction and shows a possible reversal.
Pros and Cons of the Harami Pattern
One of the main advantages of the harami candlestick pattern is that it’s easy to identify. This pattern has somewhat clear and distinctive elements that make harami easily recognizable. Another advantage is that this pattern often occurs at the reversal points where traders can achieve impressive results.
As for the disadvantages, the harami candlestick pattern is pretty adventurous. Using it is associated with considerable risk. You can only efficiently use this pattern with confirmation from other indicators. Another characteristic of the harami pattern that can be considered a con is that you don’t see it too often.
The Bottom Line
Some traders see the second candle on the harami pattern as the significant trend reversal signal and check if other indicators tell them the same.
Others perceive the harami candle as an indecision sign and prefer to halt their trades until new candles show up and make the trend direction clearer.
Either way, just like with any other market indicator, it’s better not to use the harami pattern alone. Any conclusions you may get from this pattern can be false even if you do everything right. Combining harami with other tech analysis tools is better for confirming or refuting your calculations based on the harami candle.
Related


Stay tuned
Subscribe for weekly updates from our blog. Promise you will not get emails any more often.
Our authors

Most Popular
New Posts
Stay tuned
Subscribe for weekly updates from our blog. Promise you will not get emails any more often.
Our authors


