
We continue our series of articles dedicated to trading indicators. Such topics are in demand by crypto traders, so that we won’t hesitate! The subject matter of this article is a market signal known as the bullish engulfing candle. With indicators, traders don’t just guess when to buy or sell certain coins but rely on tech analysis and make trades at the best moments to maximize profits and avoid losses. Why wander in the dark when you can use the guide that withstands the time test on the stock markets? Read this article and learn what the bullish engulfing candle is, the advantages of this indicator, how to use it in trading, etc.
What Is a Bullish Engulfing Candle?
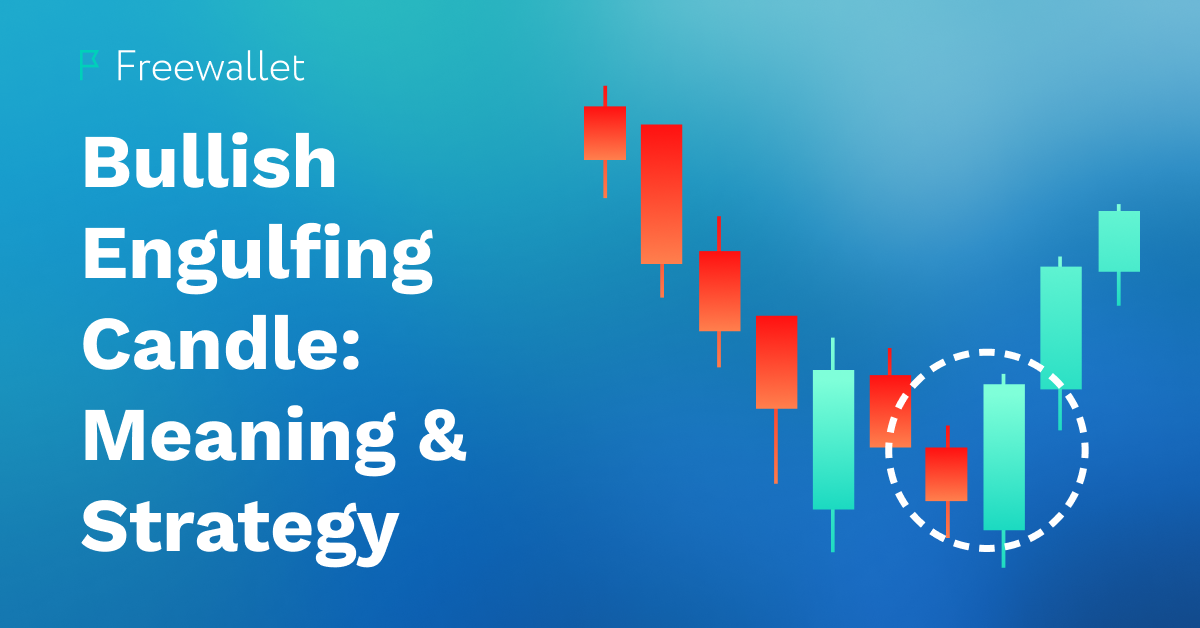
The bullish engulfing candle is quite a simple pattern. It consists of just two candles. The first of these candles is a red candle occurring at the bottom after a series of red or hollow candles at the end of a long bearish trend. The second candle is bigger than the first. It is green and opens at a lower price than the price at which the previous candle closed. The second candle closes at a higher price than the open price of the first candle. The lack of the wick in a green candle is a promise that the next candle will be green, too. However, the opposite can’t be excluded.
Please keep in mind that the crypto market never sleeps. It means that the second candle can “open” at a higher position than the first candle “closes,” and still, it can be a bullish engulfing candle. In crypto trading, the main factor is that the second candle should fully overlap the first one.
This pattern signals the drastic growth of buyers of the asset. It indeed leads to a price surge. Buyers may jump on the asset due to its price decline (buy low!), and in doing so, they quickly propel the value up. The longer the bear period, the more probable the trend reversal is, so it’s important to pay attention to the preceding candles and not focus only on the two “main” ones.
The name is derived from the fact that the second candle’s body totally “engulfs” the body of the first candle. Like all other market analysis tools, the bullish engulfing candle was introduced before the emergence of cryptocurrencies and is considered a trustworthy indicator with a favorable risk-to-reward ratio. However, if misused, it won’t play out that well. The same can be said about other tech analysis tools, though.
When Does a Bullish Engulfing Pattern Appear?
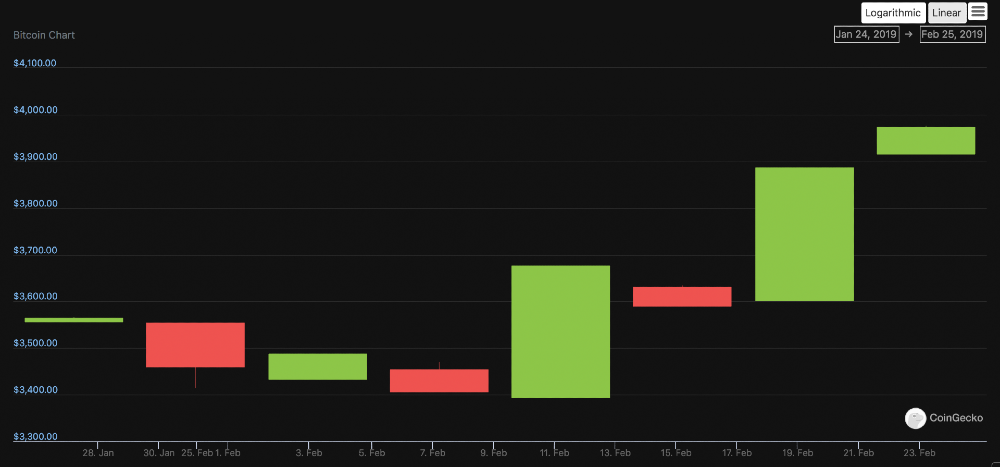
Usually, a bullish engulfing candle can be spotted after a correction preceded by a strong uptrend. The correction can be shorter than an uptrend period before the price decline. A bullish engulfing candle usually signals a trend reversal. Correction finishes, and the asset price begins to surge, reaching new highs.
At times, an uptrend following the bullish engulfing candle excels the one that precedes the correction so that this pattern can be met with optimism. Some caution and accuracy in reading the charts are a must, as mistakes and carelessness can cost too much. Please don’t rely solely on this indicator and confirm its signals using other analysis tools.
How to Trade Crypto with a Bullish Engulfing Pattern
First, you should learn how to identify a bullish engulfing candle. In the crypto market, the second candle doesn’t necessarily open at a price lower than the “close” position of the red (first) candle. The higher open price of the green candle is quite a usual thing. As the green candle closes at the level above the previous (red) candle, we can state that the engulfing pattern takes place. If you see that after a correction period, the bottom red candle gives way to a green candle of a much bigger size (especially if the green candle starts at a lower position than the red one’s close position), then most probably it is a bullish engulfing, a bullish trend reversal pattern.
As soon as you confirm this pattern, you can post a stop-loss order targeting the price below the low-swing sector of the pattern. It is vital to trade with caution even if you clearly see a bullish engulfing pattern. The reason is simple: some traders will wait for a better option. If their amount is considerable, the market will consolidate rather than a surge. However, the probability of a reversal to a bullish market is high. The risk zone is the sector below the swing low.
Benefits of Trading the Engulfing Pattern
The bullish engulfing pattern has characteristics that make it a popular, convenient, and reliable analysis tool. Some trend reversal patterns resemble other patterns that lead to opposite conclusions hence actions. Such mistakes can lead to loss of funds. Unlike several other patterns, the bullish engulfing can be clearly seen in the chart, and the chance of a mistake is much lower. If you see that the red candle at the bottom of the bear market is followed by a green candle fully overlapping the red one, you probably spot this indicator.
Another notable benefit of this pattern is that using it can easily prevent serious risks. For instance, if you use stop-loss orders targeting the swing low zone, the risk-to-reward ratio will be around 1:2. As far as half of your trades are profitable, your portfolio keeps on growing.
Bullish Engulfing Pattern Trading Tips for Crypto
We have mentioned that to avoid unnecessary risks, it’s important to use multiple indicators instead of relying on a single tech analysis tool. Using several indicators at once will decrease the probability of mistakes. But risk management is not the only reason why you should combine indicators. Below you can see how traders use bullish engulfing alongside other signals to improve their performance.
Tip #1: Moving Average as a Bullish Engulfing Pattern Indicator
Use a 200-period simple moving average indicator to check if the price can go even higher. To spot this probability, you should look if the price reaches the moving average line. If the trend reversal starts at that level, the price is expected to boost significantly.
Tip #2: Trend Line Support Near the Engulfing Pattern
You can use a bullish engulfing pattern together with the support trend line to estimate the possible price of the asset. Check the market consolidation at the lower sector of the charts. If you detect that the consolidation is fading and the market goes up, you can put the support trend line on the point of the engulfing candle break and the previous bear market bottom. This will give you an idea of the future highs that will likely hit the chart soon.
Tip #3: Horizontal Support for the Engulfing Candlestick
In the bull market, prices gain new highs and then retrace in corrections. However, after the bullish engulfing candle, a previous higher high has a significant chance of becoming a new low, effectively turning to a new support level.
Final Thoughts
The bullish engulfing candlestick is one of the easy-to-spot signals. The structure of this indicator is quite simple. It makes bullish engulfing an excellent and handy advisor for many traders, including traders with little experience. However, bullish engulfing is not something extraordinary. Using it isolated from other trend reversal signals is risky. Happily, there are many strong indicators, many of which were already covered in our blog, and we will keep on shedding some light on other analysis tools. Stay tuned!
Related
Stay tuned
Subscribe for weekly updates from our blog. Promise you will not get emails any more often.
Our authors

Most Popular
New Posts
Stay tuned
Subscribe for weekly updates from our blog. Promise you will not get emails any more often.
Our authors


