
Hidden bearish and bullish divergences are useful technical signals that tell traders who rely on them whether a market is about to resume the main trend.
Their particularity is that they don’t work as reversal signals but as continuation patterns to spot possible changes when markets are in one of the most uncertain phases – consolidation.
This type of divergence is a subcategory of divergences used by technical traders to spot new trends.
In this article, we will analyze divergences as a category and the different types of divergences – their characteristics and what they indicate. Moreover, we’ll give you some useful information on how traders actually use divergences.
What Is Divergence?
As the word suggests, divergences occur when the behavior of a price is opposite to what we expect from the observation of a technical indicator.
In layman’s terms, there is a divergence when, for instance, an indicator tells you that a price should rise, but it actually falls.
Technical traders use divergences as important indicators that can be found in price charts since they indicate that a price change is about to happen.
There are different types of divergence, but we can start by dividing them into two main categories:
- A bullish divergence may signal that the price is about to rise,
- A bearish divergence, on the contrary, may signal an imminent downturn.
Traders who follow these signals for their trading strategies will change their plans accordingly:
- If they spot a bullish divergence, they close their short positions or place buying orders;
- If they spot a bearish divergence, they close their long positions or start shorting the market.

How most technical traders use divergences – also in crypto trading.
As part of technical analysis, these kinds of indicators and signals can be used also for crypto trading. But to be even more specific, let’s analyze some other categories of divergences.
What Is Regular or Classic Divergence?
Among the sub-categories into which we can divide divergences, regular or classic divergences tend to be used as more reliable signals when found at the end of a trend. That’s why they’re considered reversal signals:
- When traders spot regular bearish divergences at the end of a positive trend, they expect an upcoming bearish trend;
- On the other hand, if they spot a regular bullish divergence at the end of a downtrend, they expect a new uptrend soon.
The reason why these kinds of divergences are called “regular” or “classic” is that they clearly do what you expect from a divergence:
- In a regular bullish divergence, while the chart shows you lower lows for a specific asset, the indicator you chose shows higher lows;
- The opposite occurs in a regular bearish divergence: charts show higher highs, while indicators show lower highs.

BTC/USD pair, Bittrex price chart. Example of regular bullish divergence using MACD (Moving Average Convergence Divergence). Source: TradingView.
What Is Hidden Divergence?
This type of divergence is called “hidden” because, most of the time, you don’t immediately see the divergence.
Actually, the difference between hidden divergences and classic divergences is very subtle, and when it comes to hidden divergences, the position where you find them is what matters most.
In fact, hidden bullish and bearish divergences work as follows:
- A hidden bullish divergence occurs when the price shows higher lows, but the indicator shows lower lows;
- A hidden bearish divergence occurs when the price shows lower highs, but the indicator shows higher highs.
As you can see, the difference with regular divergences is small, but you can find them at the end of the consolidation phases.

BTC/USD pair, Binance price chart. Example of hidden bullish divergence using RSI (Relative Strength Index) as a technical indicator. Source: TradingView.
When to Use Regular or Hidden Divergence
To easily assess when it’s the right moment to use a type of divergence instead of another, consider the specific phase of a market:
- Regular divergences can be used if a trend is developing, and you want to spot the possible end of the current trend and the start of a new, opposite trend;
- Hidden divergences are mainly used when the market is consolidating and you want to know when the main trend will resume.
How Is Hidden Divergence Different?
As mentioned, the main difference between regular and hidden divergences is the position where you can find them on the price chart – while regular divergences are usually located at the end of a trend, hidden divergences can be found at the end of consolidation phases.
But why is this important? Because the different position clearly assesses the different nature of these two types of divergences:
- Regular or classical divergences work as reversal signals;
- Hidden divergences work as continuation signals since the main trend is resumed after the consolidation phase.
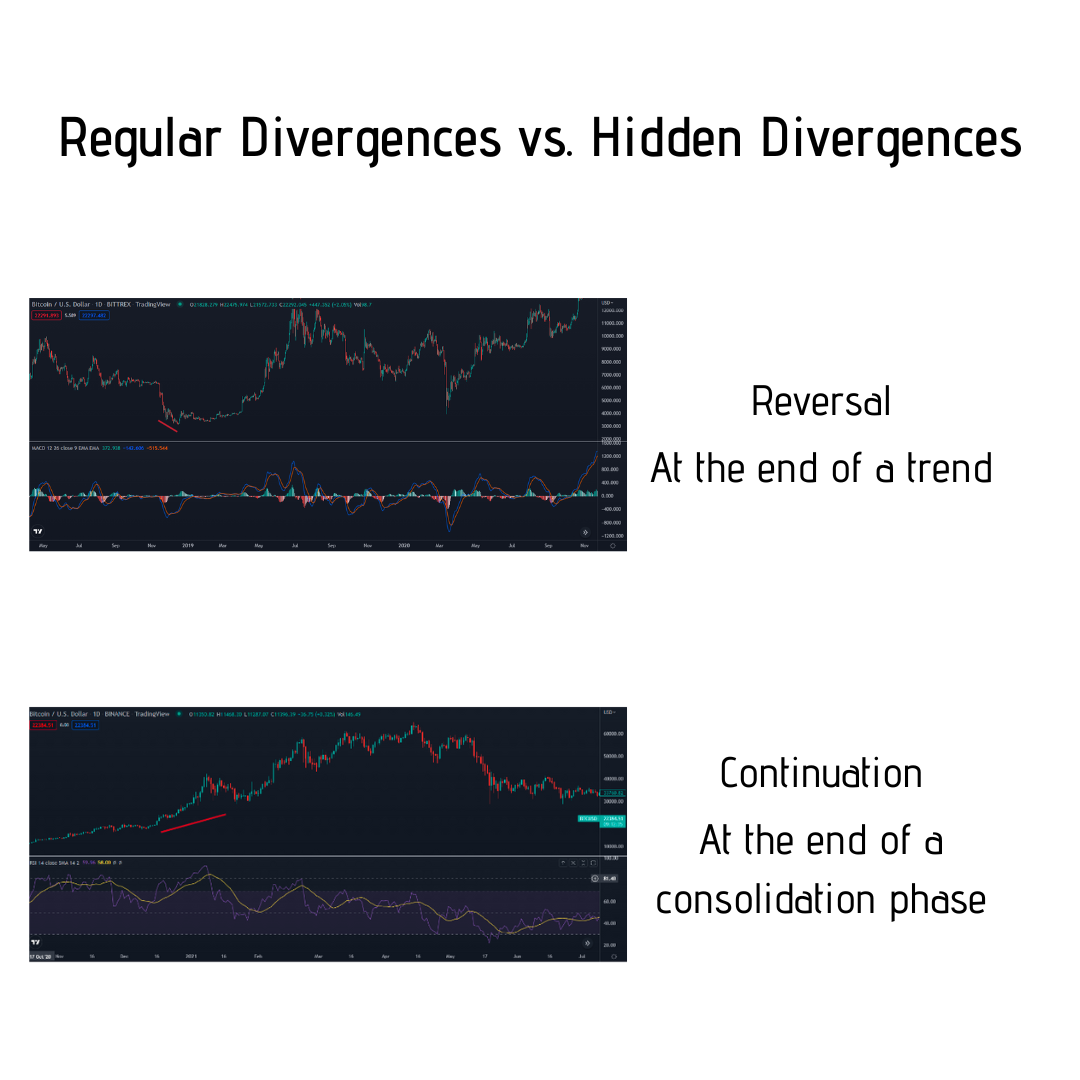
Regular divergences vs. Hidden divergences. Despite differences, traders use oscillators to spot both.
Limitations of a Hidden Divergence
Hidden divergences are often hard to spot correctly.
Especially when you’re analyzing a market in real-time, it can be hard to fully understand if it’s the end of a consolidation phase or just a very-short term change in the market.
It’s even harder if you’re prone to emotional trading because your emotions might lead you to draw the wrong conclusions.
Moreover, even if you correctly spot a hidden divergence, the possible earnings could be extremely low or even turn into losses, especially if the end of the sideways movement is close to the end of the main trend.
Conclusion
Divergences are handy indicators if you want to spot possible upcoming changes in the market – namely the end of trends or consolidation phases.
They’re technical indicators, and technical analysis is not a science – otherwise, everyone could become the perfect trader and earn billions in crypto trading.
That’s why you shouldn’t rely on a single indicator to set your whole trading strategy, but rather include each signal into a broader picture created by taking into account more indicators.
Here’s a pro tip: usually, the more indicators drive you towards the same conclusion, the better!
FAQ
What Is Bullish Divergence?
A bullish diverge occurs when a price chart shows you lower lows, but the technical indicator you chose shows higher lows.
What Is Bearish Divergence?
A bearish divergence occurs when prices form higher highs, but your technical indicator shows you lower highs.
How Can You Identify Bullish Divergence?
If you find that a price chart is showing lower lows, while the oscillator you’re using as a technical indicator shows higher lows, you identified a bullish divergence.
What Does Hidden Bullish Divergence Mean?
Hidden bullish divergences are usually found at the end of a consolidation phase and indicate that the main uptrend is about to resume.
How Do You Detect Divergence?
To detect divergences, traders use technical indicators like RSI, MACD, and Stochastic – that is, the main oscillators.
What Causes Divergence?
Divergence is caused by the opposite behavior of prices and technical indicators. These are helpful because they usually manage to spot price developments shortly before the price chart itself.
How Do You Trade with Divergence?
Traders who use divergences close long positions or short the market when they detect a bearish divergence. On the other hand, they exit short positions or go long when they find bullish divergences.
How Reliable Is Divergence?
Diverges can be considered quite reliable because they are signals used by several technical traders. But you should always avoid relying on a single indicator to set your entire trading strategy.
How Do You Spot Bearish Divergence?
You can spot bearish divergences when the price chart shows higher highs, but the oscillator you’re using as a technical indicator shows lower highs.
What Does Divergence Mean in Trading?
A divergence is formed by the opposite indications you receive from prices and technical indicators.
Related


Stay tuned
Subscribe for weekly updates from our blog. Promise you will not get emails any more often.
Our authors

Most Popular
New Posts
Stay tuned
Subscribe for weekly updates from our blog. Promise you will not get emails any more often.
Our authors


