
Today we’re going to take a look at the Wyckoff strategy – one of the oldest and most well-known market theories out there. It has stayed surprisingly relevant over the course of decades, and while few traders rely solely on it these days, most of them incorporate parts of the theory into their trading.
This is a complicated topic, and most articles on it are very wordy. Since real understanding can come only from practice, we’ll try to be concise and give you only useful pieces of information.
If you’re completely new to crypto trading, this article alone won’t help you much. You should first check out a broader guide on trading in general, the terms of the craft or reading crypto charts (like this one or this one).
What is the Wyckoff strategy?
The Wyckoff theory was developed in the beginning of the 20th century by Richard Wyckoff, investor and stock market analyst. It helps recognize certain patterns in the fluctuation of an asset price and attempts to work out where the price of the stock will go (as is the case with all market theories). It also deals with the psychology behind the stock market.
One of the cons of living in early XX c. is not having any hi-res shots of you on the web
The two main ideas behind Wyckoff’s theory are a) accumulation and distribution happen in consolidation; b) the consolidations themselves happen in particular sequences. Those sequences are called phases, the phases have specific events that occur within them. Realizing what phase the stock is currently in and what event is about to happen helps you make an investment decision.
Understanding the Three Wyckoff Laws
The Law of Supply and Demand
- The price increases when there are more buyers than sellers (demand exceeds supply);
- The price decreases when there are more sellers than buyers (supply exceeds demand);
- When these two outweigh each other, the stock stops being volatile and enters a price plateau.
The line between supply and demand can be distinguished by studying price bars.
The Law of Cause and Effect
- An increase or a decrease in the price of the stock comes after a period of preparation;
- The cause of a bullish cycle (markup) is an accumulation period;
- The cause of a bearish cycle (markdown) is a distribution period.
The Law of Effort and Result
- The market trend continues as long as the price of the stock and its trading volume are in harmony;
- Once these two start to divert significantly, the trend is about to change.
The Composite Man Concept
Turns out Wycoff gave the best answer to all of the stock market conspiracy theories before most of them were developed. He stated that it doesn’t matter if the price fluctuations are caused by mysterious behind-the-scenes oligarchs or regular trading Joes like you. In order to benefit, you have to act like a big player yourself.
The composite man, or the composite operator, is the imaginary identity of the market. The concept suggests that it’s easier to study the psychology of the market if you imagine it is controlled by one person only. Kind of like learning to play poker with your friend: when you play one on one as a rookie, it is easier to start seeing through your opponent and predicting their move.
According to the theory, the majority is always wrong. Most people jump on a stock when there is no benefit in it for them, because the composite man has already bought large shares of it and merely advertised it to be profitable.
So Wycoff echoes Warren Buffet and warnings in all our articles: he strongly advises you to conduct your own research, study graphs, the supply/demand ratio and fundamentals of the company before making any investment or trading decisions. The man was truly ahead of his time.
Wyckoff Price Cycle
The Wyckoff price cycle is divided into five different phases, named from A to E, and each contains 8 events, which are named by abbreviations. There are going to be a lot of them in the next section, and the first one you need to learn is TR – trading range. TR is a relatively flat section on the graph, and simultaneously the one that is most closely analyzed. When in the TR, the Composite man prepares for the next bull or bear period by buying or selling shares.
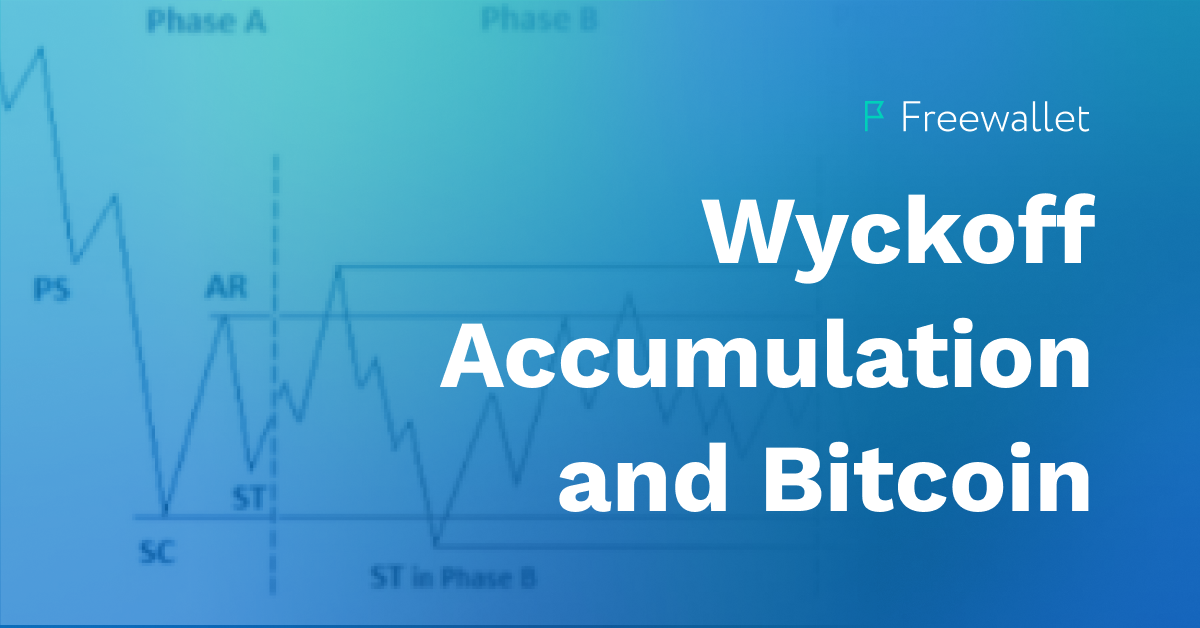
Wyckoff Accumulation: Phases and Events
In the Wycoff theory, accumulation comes after a bearish cycle called a markdown, when the price has been continually dropping for some time.
During the accumulation phase, buyers gradually gain control over the market, and this means that an increase in price is coming.
When in the accumulation area, the stock is considered oversold.

PHASE A
In phase A, we see the reverse of a previous trend: the dropping price starts rising. From now on, demand will slowly start dominating the market.
As we can see, it is also the richest phase in terms of events, but we’ll dive into those later.
PHASE B
The longest phase of accumulation. Phase B is the best illustration for the second law of Wyckoff, since it is precisely the time of preparation for the future uptrend.
During phase B, stock is being bought at a cheaper price by the Composite man before it eventually rises. It may also contain several ST’s (called STb’s for convenience) setting the new lows of the overall price, which induces regular traders to panic sell and again benefits big players. Price swings are usually much more drastic at the beginning of the phase, gradually smoothing out towards the end.
PHACE C
This phase is usually the last attempt to buy shares at a low price.
PHASE D
The last phase before the new trend: cause slowly turns into effect. When in phase D, you need to watch out for the bear trap: The price may first exit the support line and then enter it again a couple of times.
PHASE E
The price breaks out of the trading range. From now on, demand is the king, and an obvious markup (bullish) trend starts. During phase E, the price may drop a little bit, but it’s not going to last long.
EVENTS
PS = Preliminary support. Buyers get a slight upper hand over sellers for the first time. A sign that the downtrend may be over. This usually sees an increase in volume and wider price ranges.
SC = Selling climax. The public panic sells, the Composite man accumulates low-price shares.
AR = Automatic rally. The selling pressure slackens up, and now buyers gain control again. The automatic rally sets the resistance line for the entire TR.
ST = Secondary test. The price goes back to the level of SC to test the equilibrium of supply and demand. Here, trading volume and market volatility tend to be lower. Note that secondary tests may occur several times.
STb = Secondary test in phase B. We’ve largely covered it in the “Phase B” section.
SOS = Sign of strength. The price is slowly going up with high volume and large spread.
LPS = Last point of support. The drop of a price as a reaction to SOS. Just like ST’s, these may also come in droves, which you can see on the graph above.
BU = Back-up. An alternative term to LPS.
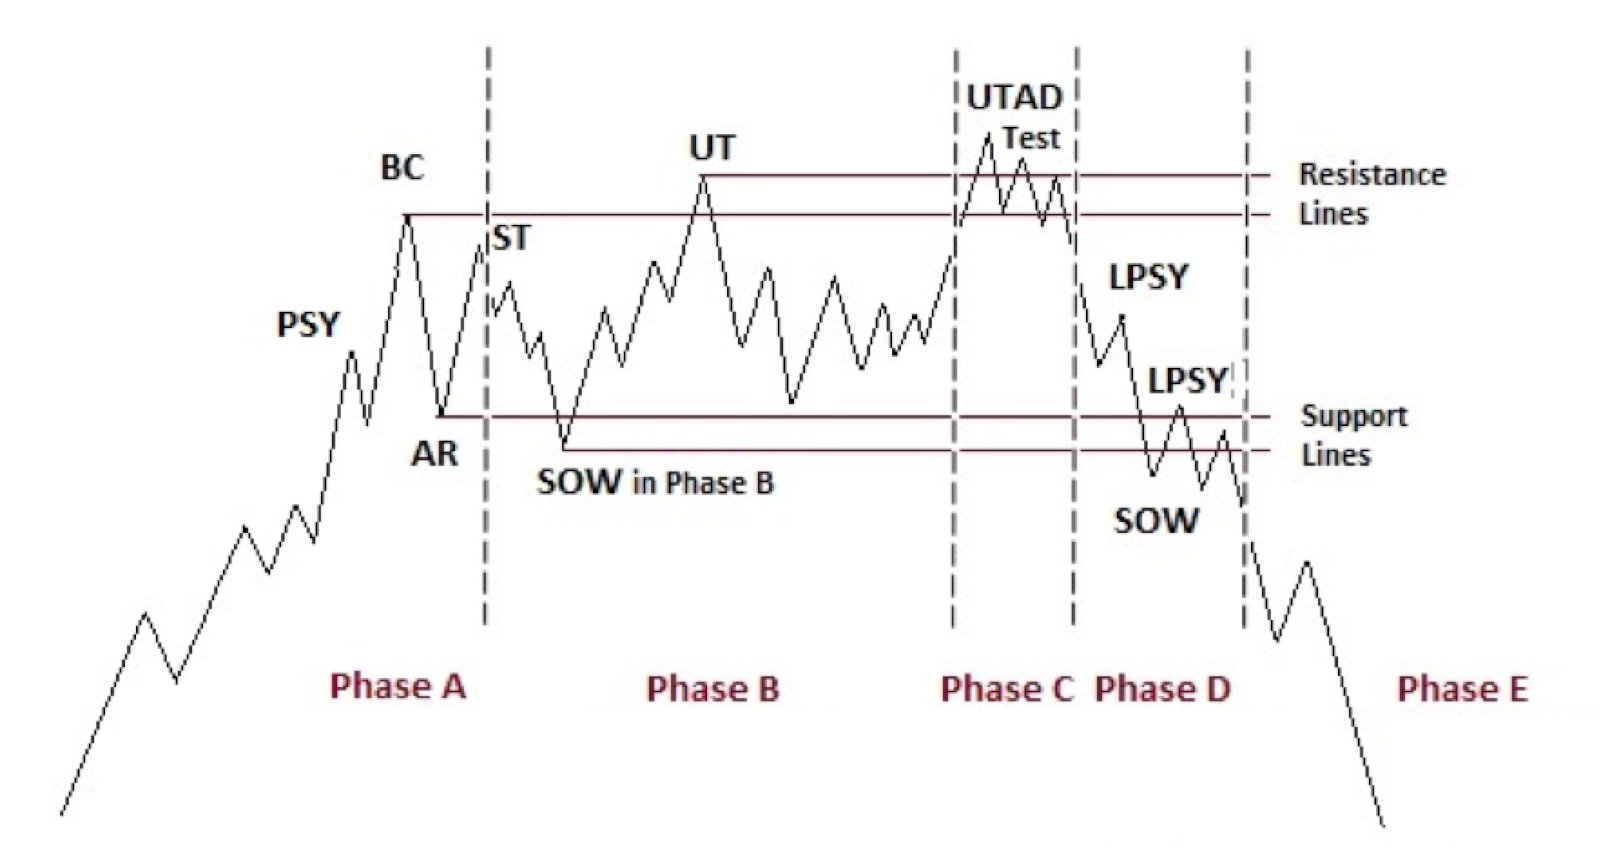
Wyckoff Distribution: Phases and Events
Distribution comes after a bullish cycle called markup, when the price has been continually rising for some time.
During the distribution phase, sellers gradually gain control over the market, and this means that a decrease in price is coming.
When in the distribution area, the stock is considered overbought.
This phases is going to be rather similar to the previous one, so you may skip it altogether keeping in mind that everything is an exact reverse of accumulation.
PHASE A
Demand exhausts itself; the previous trend stops and supply is taking control over the market.
PHASE B
The market is preparing for the future downtrend. Large players are selling off shares and entering shorting positions.
PHASE C
In this phase, the price momentarily breaks out of the TR only to enter it back again.
PHASE D
The price fluctuates on the border of the TR, and it’s high time to exit long positions.
PHASE E
Price finally starts dropping, however there still may be some weak bullish rallies.
EVENTS
PSY = Preliminary supply. Higher volume and wider price range. Watch out for the reverse of the trend.
BC = Buying climax. Again, increased volume and price range. This usually happens when there is some good news about the stock and the general public is inclined to buy it.
AR = Automatic reaction. Here, the price will set its all-time low for the TR.
ST = Secondary test. The price plummets again to the level of BC.
SOW = Sign of weakness. A slight dip below the support line. From here on, supply is going to be dominant.
LPSY = Last point of supply. Either the demand is too feeble or the supply is too strong. Whichever it is, the decrease in price is pretty near.
UTAD = Upthrust after distribution. The equivalent of the bull trap in accumulation. Note that it does not happen in every distribution cycle.
Bitcoin and Wyckoff Method
This may sound like the most interesting part of the article, but actually there is not much difference in applying Wyckoff’s theory to Bitcoin and other crypto assets when compared to traditional stock.
The only crucial thing to keep an eye out on is the notorious volatility of the crypto market; here, all the dips will be lower and all the shifts less predictable. So any investor entering the crypto sphere needs to prepare himself or herself for potential huge gains and huge losses.
How Reliable Is Wyckoff’s Theory?
The theory works, and it has even been called the most reliable trading theory. But a lot of traders advise against using it, especially for beginners, since it’s so overly complicated. The patterns may be easy to identify when you’re looking at a still screenshot with all the phases marked out, but recognizing them in a live market is much harder. There are a lot of similarities in the behavior of the market. However if you want to use that to your advantage, you need to develop your gut feeling and not just learn to compare graphs with pictures from a textbook.
Conclusion
Now you have the basics of Wyckoff theory and know why it is so important. If you want to go deeper with this topic, there are entire courses on YouTube dedicated wholly to Wyckoff style trading, and some of them are even directly tailored to crypto trading. Good luck!
Related

Stay tuned
Subscribe for weekly updates from our blog. Promise you will not get emails any more often.
Our authors

Most Popular
New Posts
Stay tuned
Subscribe for weekly updates from our blog. Promise you will not get emails any more often.
Our authors


