
Cryptocurrencies are much younger than trading. The emergence of Bitcoin and other crypto assets has introduced trading to a new audience. Unlike cryptocurrency, trading has been developing for many decades. All of its strategies and tools are suitable for cryptocurrency trading.
We continue to cover all the general trading-related themes, as this knowledge base can be handy for cryptocurrency trading. This time around, we will speak about so-called butterfly patterns. Reading this article, you will learn what butterfly patterns are, what bullish and bearish butterfly patterns mean, how these patterns can improve trading, and so on.
What Is a Butterfly Pattern?
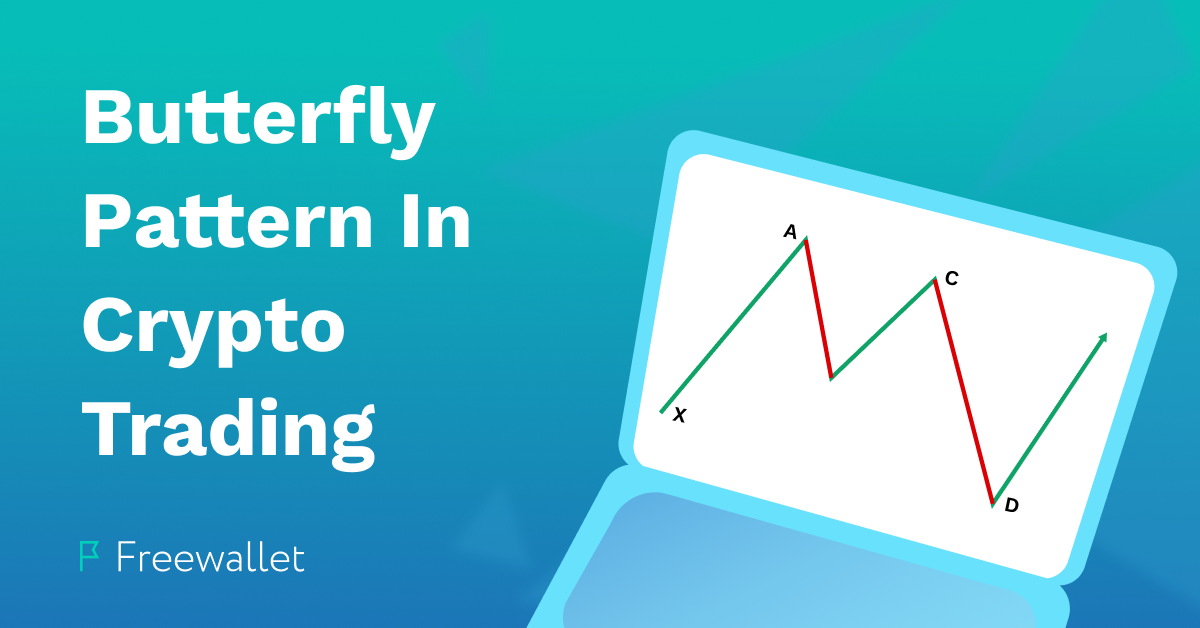
Butterfly patterns are certain price patterns that can be spotted on the graph. The pattern consists of a zigzag line crossing five points on the chart. These points have a specific ratio, so the lines make up a Fibonacci retracement. This pattern helps to spot the trend reversal points and correctly predict upcoming price changes.
There are two kinds of butterfly patterns: bearish and bullish ones. If the pattern is bearish, traders make short trades. In the case of bullish patterns, traders perform long positions.
Butterfly Pattern History
The butterfly pattern is an individual case of harmonic patterns. Harmonic patterns were introduced nearly a century ago by H.M. Gartley. Harmonic patterns indicate the current price trends and help to guess the future prices based on these graph patterns. The lines in harmonic patterns are based on Fibonacci numbers. They show the price potential and allow traders to spot retracements. There are a few different patterns bound in the harmonic patterns group. Some of them were invented after Gartly. For instance, the butterfly pattern was described by Bryce Gilmore.
How to Identify a Butterfly Pattern?
The pattern has four parts, usually marked as X-A, A-B, B-C, and C-D. The crucial measure to the butterfly pattern is a 0.786 retracement of the X-A leg. As soon as you spot the X-A ratio, you can trace the position of the B point and find the entire potential reversal zone (or PRZ).
The rest ratios can be constant or variable. They are A-B (0.786), A-C (from 0.382 to 0.886), B-D (from 1.618 to 2.618), X-D (from 1.27 to 1.618), and X-B (0.786).
Identifying a butterfly pattern might seem an uneasy task for an inexperienced trader. However, if you see the specific “butterfly” lines construction on the graph, you should measure a couple of ratios. Usually, it is enough to know if you are dealing with a butterfly pattern. If you see a butterfly pattern, you should figure out if the trend is bearish or bullish.
You can tell if the pattern is bearish or bullish if you look at the C-D leg. It determines the trend’s direction as it will be opposite to the direction of the C-D line.
Bearish Butterfly Pattern
There might be different ratios between the axis, but if X-A and B-C lines are descending, then the D point is the peak position. After the D spot, the trend will go down. This type of butterfly pattern is bearish.
Bullish Butterfly Pattern
The bullish trend mirrors the bearish one. So if you see a butterfly pattern with ascending X-A and B-C lines, then it is a bullish pattern. The D point is considered to be the bottom price in the sector. After passing the D spot, the price is expected to go up.
Stock & Crypto Markets: Where Can Butterfly Patterns Be Used?
As we mentioned before, crypto trading is just one of the multiple sectors of trading activity. Many of the models, indicators, and strategies developed for stock market trading have naturally become the routines of cryptocurrency trading. Harmonic patterns are cracked down on the websites addressed to stock market traders and crypto enthusiasts. Both can take advantage of using this knowledge in their respective spheres. Long and short positions are possible on both stock and crypto markets. Therefore, you can also use the butterfly pattern with stocks and crypto assets.
Although the structure and purpose of the butterfly pattern for crypto and stock markets are the same, there are some differences in place, as well. The main difference is the accuracy of the butterfly pattern-based predictions. This model works pretty well for stock markets. However, you should be aware that the price/trend predictions are less accurate if you use the butterfly pattern for crypto trading. It doesn’t necessarily mean butterfly patterns are ineffective in crypto trading. They are. But to avoid missteps, you should better check the conclusions you make from this model using other indicators. Probably it’s better to hold on if you get contradictory results after using different analysis tools. Relative strength indicator (aka RSI) and Stochastic RSI can help test the butterfly pattern’s effects.
How to Draw Fibonacci Extensions?
Although many exchange platforms offer Fibonacci number-based grids as a supported indicator, not all traders take Fibonacci retracement and extension tools seriously. They don’t believe this natural ratio has anything to do with the trading world. There is no proof that the golden ratio is inherent to market trends. The idea that the proportions of the seashell shape will be repeated in the ratios in the price moves doesn’t seem intuitive. It can seem strange that price reversals will obey the golden ratio law.
However, despite this skepticism, Fibonacci numbers often help predict the reversal point or zone and other trend-changing spots on the graph. On top of that, Fibonacci extension analysis helps to trace new resistance and support levels. The inaccurate use of Fibonacci retracements leads to false analysis results, mistakes, and losses. If you use it the right way, it may help you to complement other indicators with a strong price reversal signal. So if you try using Fibonacci numbers in trading, you should learn how to draw Fibonacci extensions.
The original Fibonacci numbers row looks this way: 0, 1, 1, 2, 3, 5, 8, 13, 21, 34, 55, etc. Each number is the sum of the previous two numbers. For Fib extensions, traders use smaller complex numbers based on the division of the numbers, not addition. The row includes 0, 0.236, 0.382, 0.5, 0.618, 0.786, 1, 1.618, and 2.618.
Note that 0, 0.5, and 1 do not belong to the Fib ratio. They are added to the starting point, the mid part (to indicate the halfway market trend change), and the top part, respectively.
The main challenge is to place Fibonacci grids properly. If you make a mistake, you will get misleading results, signaling you to buy or sell cryptos at unprofitable prices.
To find the right place and time for the Fib extension, you should spot the longest bearish or bullish trend. Then, you should put an ascending Fibonacci grid on an uptrend and a descending Fib grid on a downtrend. The grid should contain the 0.382, 0.5, 0.618, and 0.786 retracement points.
The price will likely be highly volatile in the first three ratios segment. The 0.786 point usually gives an idea about the trend reverse. The next step is finding short-term trends and placing Fib grids over them. As soon as you finish this, you will get a graph covered with Fib grids with tightly aligned lines and lines without aligning. The former can be used for relatively accurate predictions and usually display such essential data as new levels of resistance and support, the correction borders, etc. The lines that don’t have alignment can be misleading.
Conclusion
In general, the butterfly pattern can be a helpful tool for traders that deploy the Fibonacci grids accurately. Precision and caution are important here. Using other indicators, you can always ensure the correctness of the data you get from the butterfly pattern. Bundled with other analysis tools, the butterfly pattern can be an excellent tool for maximizing your profits.
Related


Stay tuned
Subscribe for weekly updates from our blog. Promise you will not get emails any more often.
Our authors

Most Popular
New Posts
Stay tuned
Subscribe for weekly updates from our blog. Promise you will not get emails any more often.
Our authors


