
When the trend changes, the direction is one of the most critical points. The peak of the uptrend is the best time to sell an asset. Can we predict this moment more or less accurately? Happily, the answer is yes. There is plenty in the analysis methods indicating a soon trend reversal. It doesn’t mean that any of them can be chosen and used separately from the rest. To make precise predictions, you should combine different methods to confirm the most probable events in the charts.
We have covered numerous trading indicators before. This time we will speak about the evening star pattern. Traders use it to predict when the uptrend finishes and the price starts declining. From the article, you will learn what the evening star pattern is, how to use it in crypto trading, and how it differs from other indicators.
What Is an Evening Star Pattern?
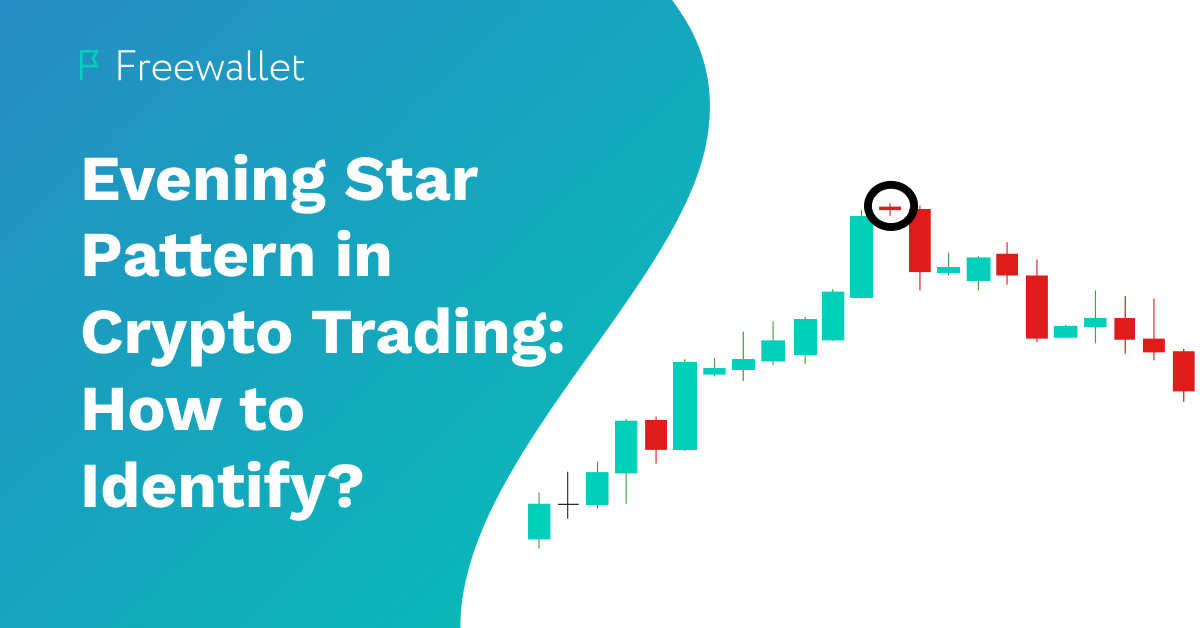
The evening star pattern is a specific pattern that can be spotted on the candlestick chart. It signals the end of the bull market and a sharp twist to a bear market. The evening star is preceded by several solid-body green candles indicating a solid bull market. Then, at the price peak, there is a hollow candle or a candle with a short body. It fixes a moment of market consolidation. Then, the price goes down, and the next candles are red. The pattern where the short-body candle is preceded by red candles and followed by green ones is called a morning star pattern and serves as a bullish signal. The evening star pattern is pretty rare and trustworthy.
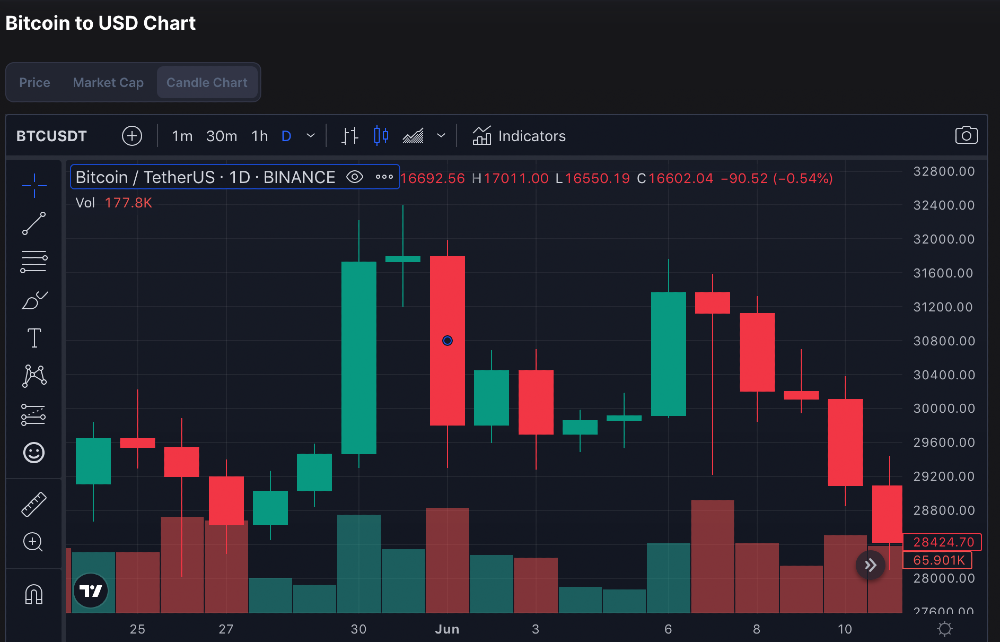
Candlestick charts are the usual element of cryptocurrency exchanges. It showcases several characteristics of the asset on the market at the given moment, namely the open, high, low, and close prices. The price direction is usually expressed via green (upward movement) and red (price decline) colors.
The “body” of the candle shows the price range between its open and close positions at a certain time frame. The longer the body, the more significant the difference between the open and the close prices is. The short candles indicate low market activity. Apart from the body, there can be up to two “shadows” (at the bottom and the top) for each candle. Sometimes, shadows are referred to as wicks” — especially the upper ones, while the bottom shadows are sometimes called “tails.” Wicks stand for the highest price in the given period, while tails show the lowest price. Knowing the basics of the candlestick graph is a must if you want to learn how to read the evening star pattern.
The evening star pattern is used in crypto trading. Still, like many indicators, it was developed long before the emergence of cryptocurrencies and has been used in stock trading. A slight difference between using technical analysis tools in crypto and stocks is that the crypto market is more volatile. Hence, the patterns form and change quicker than in traditional markets.
On stock markets, the formation of the evening star pattern usually takes around three days. The first day showcases the most bullish trend forming a long green candle. On the second day, the trading activity gets slower. The price keeps on rising, but the growth gets much slower. At the end of the second day, you can see that the range between the open and close prices is negligible. The third day forms a big red candle. The price drops below the middle level on the first day. Please note that crypto markets work 24/7, meaning that this cycle can be shorter than three days.
How to Use Evening Star Patterns?
Detecting the evening star pattern on time is not an easy task. The elements of this pattern can go unnoticed in an overwhelming crypto market data flow. To increase the chances of timely detection of this pattern, you can use such tools as price oscillators, trendlines, etc. To prevent false positive evening star pattern detection, you should confirm the pattern formation via other indicators and analysis tools. If your assumptions about the alleged evening star pattern contradict the predictions you got using other tools, the evening star is probably not taking place.
It is dangerous to rely entirely on a single indicator, the evening star pattern or another. Indicators’ accuracy is relative and limited. Add to it that you can mistake one pattern for another. Such mistakes can cost you a lot of money. Use other bearish signals to confirm predictions you have made via the evening star pattern.
Now, let’s see what traders do when they see this pattern. For the sake of risk management, they usually place a stop-loss order that is higher than the current price. Some consider setting the order at a two-time bigger price than the stop-loss entry level. This strategy has a 33% risk probability.
How Reliable Is the Evening Star Pattern?
Traders consider the evening star as a trustworthy trend-reversal signal. Is it a reliable pattern? With some reservations, we can give a positive answer. This pattern is handy because it has a clear structure that needs only three candles, each of which has a specific role. Experienced traders detecting the evening star pattern on time fix their profits at the best rate.
Nevertheless, even this pattern can let you down. There are moments when the trend acts unusual and what you have thought is an evening star pattern can end up being a new bull run instead. It doesn’t happen too often, but you should be prepared for such a turn. More than that, if you make a mistake and think that you see an evening star pattern while it’s not, you can lose your investment. Before you invest, you’d better use other trend reversal indicators to confirm your prediction.
Evening Star Pattern vs. Other Trend Reversal Patterns
Now, let’s see the principal differences between the evening star pattern and the other bearish trends.
Evening Star vs. Bearish Harami
One of the popular trend reversal signals is bearish harami. The latter has a much simpler structure than the former. Bearish harami is formed only of two candles, a green one and a hollow-body red one. While in the evening star pattern, the price reaches a new high on day two, in bearish harami, the second-day price is lower than the first-day price.
Evening Star vs. Head and Shoulders
Another popular pattern signaling the upcoming trend change is head and shoulders. Its structure is more complex than the structure of the evening star pattern. The head and shoulders pattern formation takes at least five candles, whereas the evening star needs only three. Head and shoulders include at least three tops of which the second is the highest point, while the first and third are the lower ones.
The head and shoulders pattern can occur with or without a hollow-body wick. As the structure of the head and shoulders pattern is quite complex, it can include an evening star pattern as a part. The opposite is impossible.
Evening Star vs. Triple Top
The triple top pattern is very similar to the head and shoulders pattern described above. It needs at least five candles to form. The pattern forms in the sideways price range, while the evening star pattern forms in the bullish trend. Unlike the head and shoulders pattern, the triple top pattern has all tops around the same level. The evening star pattern can be a part of the triple top pattern.
Conclusion
Resuming all that we have said above, we can conclude that an evening star pattern is a convenient tool for short trading. The pattern is not that hard to spot if you know it well. It is reliable, but it’s better to always confirm your forecasts using other indicators. In combination with other signals, the evening star pattern is a great bearish indicator.
Related


Stay tuned
Subscribe for weekly updates from our blog. Promise you will not get emails any more often.
Our authors

Most Popular
New Posts
Stay tuned
Subscribe for weekly updates from our blog. Promise you will not get emails any more often.
Our authors


