
Hammer candlestick patterns are among the most widely used tools in technical analysis: traders use them to spot short and longer-term price waves, find suitable entry and exit opportunities, set stop loss, and take profit orders.
In this article, we will analyze the meaning of hammer candlesticks, focusing on how you can use them in crypto trading.
What Is a Hammer Candlestick?
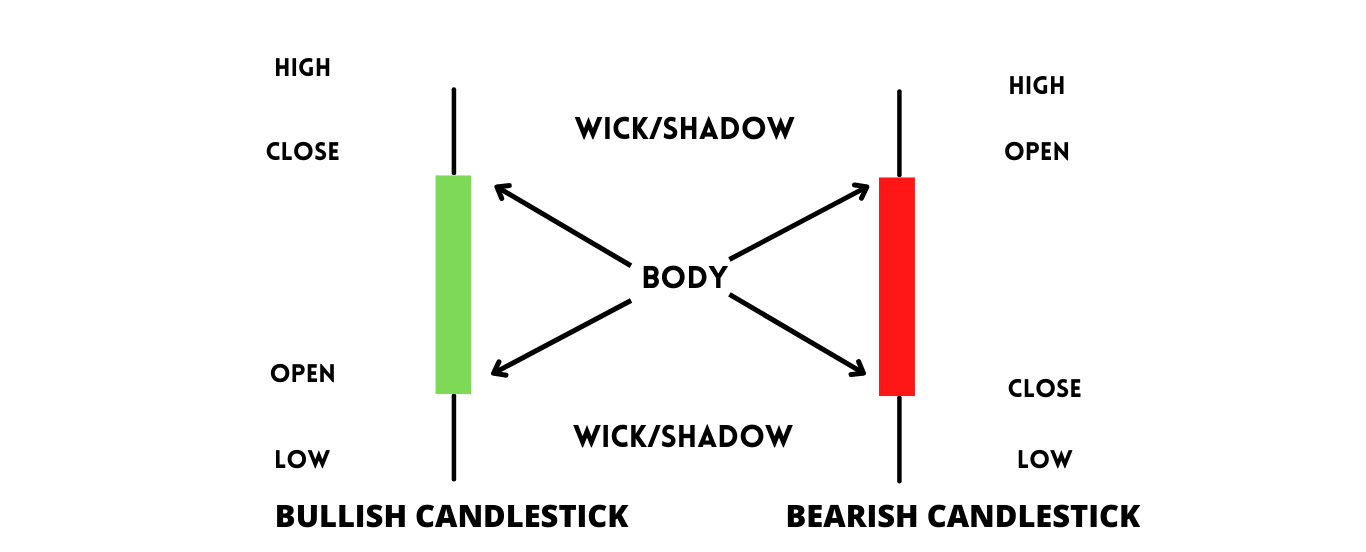
First off, it’s crucial to understand what a candlestick looks like. Today’s traders mostly use Japanese candlesticks: differently from bars, candlesticks give you more information while keeping an intuitive design. That’s the main reason behind their success in the Western world: candlesticks come from the Japanese trading tradition and were introduced in the United States by Steve Nison at the end of the Eighties.
Candlesticks are made of a body – which represents how the price traveled from the open to the close price – and wicks, sometimes referred to as “shadows” – the definition of “wick” can change according to the nature of the candlestick, so let’s have a look at a graphical representation:
The hammer candlestick is just one of the many available candlesticks; it has the characteristics we’ve described so far: each one carries a specific type of info, which can vary according to the position where you find it on the chart.
But let’s dive in and analyze the meaning of a hammer candlestick.
What Does a Hammer Candlestick Look Like?
As we mentioned, candlesticks are made of bodies and shadows, able to signal an asset’s opening and closing price in a specific timeframe, as well as the highest and lowest prices reached by that same asset.
There can be some exceptions: for instance, some candlesticks don’t have an upper or lower shadow, or they can miss both.
The hammer candlestick is included in this category of exception: its most prominent visual characteristic is that it misses one shadow. But since the hammer can take different forms, we need to analyze each separately. For now, we can say that usually, a hammer has some constant features: a small body and one wick.
Bullish Hammer
When we talk about bullish hammer candlesticks, it’s important to note that we’re not necessarily talking about the “color” of the candlestick: as you may have guessed, “bullish” candlesticks – that is, those candles where the close is higher than the open – are usually green, while “bearish” candlesticks – that is, those candles where the close is lower than the open – are generally red.
When it comes to the classical hammer, we can assess that it’s usually bullish by nature: it doesn’t matter if it’s a green or red hammer candlestick; if you find it at the end of a downtrend, chances are it’s a bullish reversal signal.
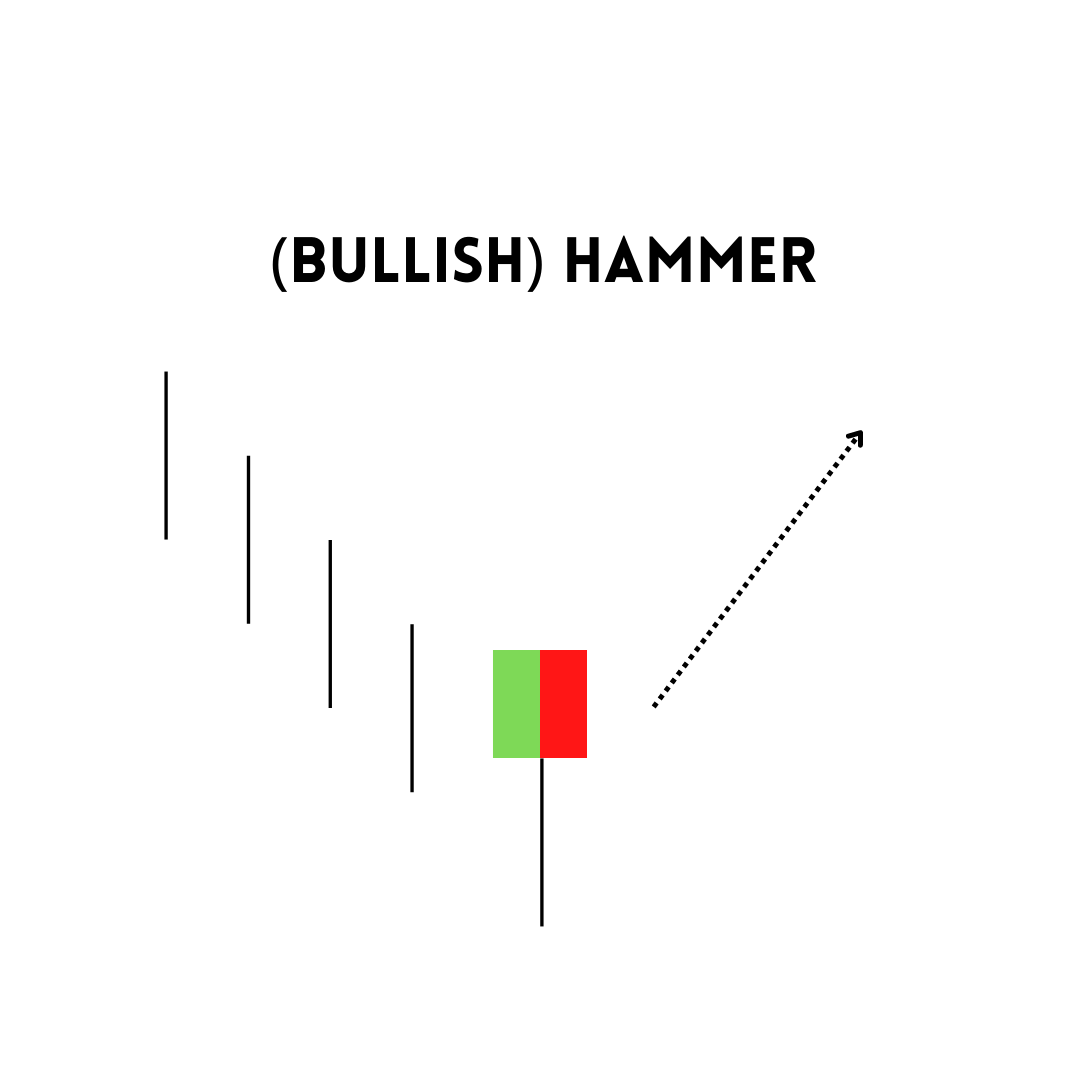
Hammer (candlestick pattern).
Bearish Hammer (Hanging Man)
A different argument is necessary for the bearish hammer candlestick, also called “hanging man” for its shape. Usually, it’s red, so it’s bearish in its color and meaning. You’ll usually find it at the top of an uptrend, often representing a bearish reversal signal.
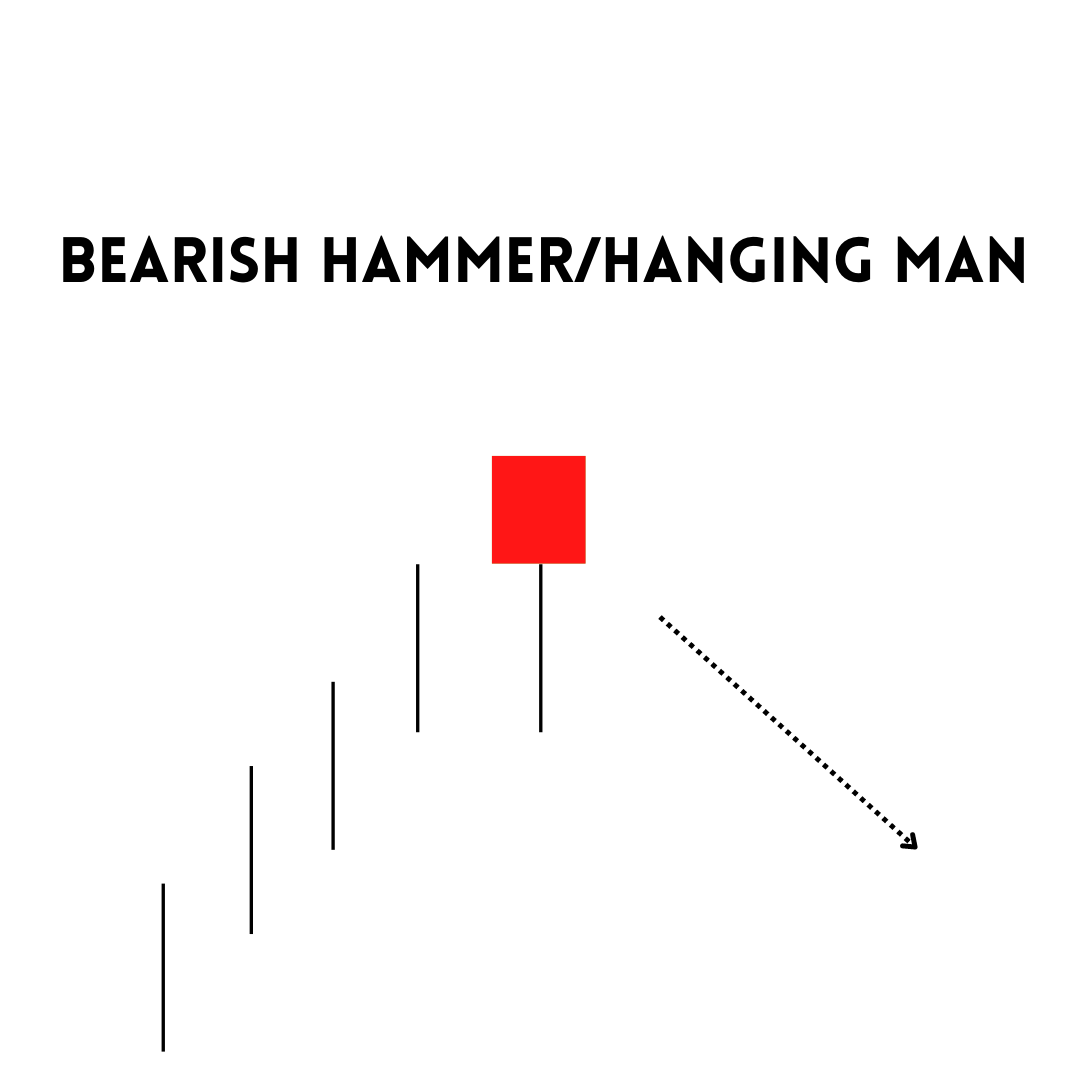
Bearish hammer candlestick.
Inverted Hammer Candlestick
Now, let’s look at an “inverted hammer candlestick pattern”. The reason for this name is straightforward: here, the body of the hammer is inverted, and the shadow of the candlestick is the upper wick and not the upper one, as we’ve seen so far.
We can identify two inverted hammers: the bullish inverted hammer and the shooting star.
Inverted Hammer Bullish
The bullish inverted hammer is usually green, and you should find it at the end of a downtrend.
As usual, the hammer should represent a reversal signal – in this case, the beginning of a new uptrend.
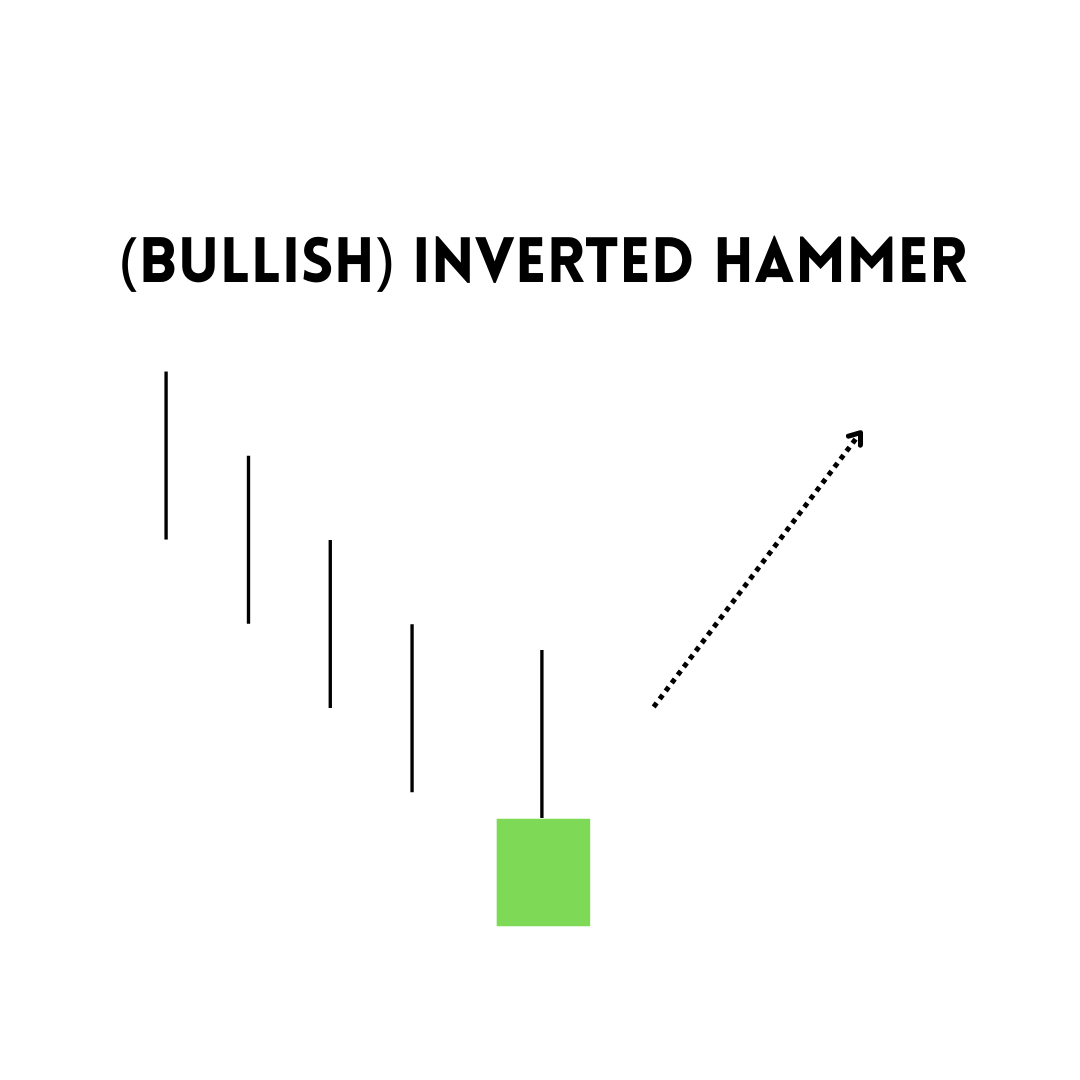
Candlestick patterns: Inverted hammer.
Bearish Inverted Hammer (Shooting Star)
Here we can repeat the exact reasoning behind the bullish hammer. You can find both green and red shooting stars; what matters is their position: an inverted hammer candlestick in an uptrend – usually at the end – can signal a reversal downwards.
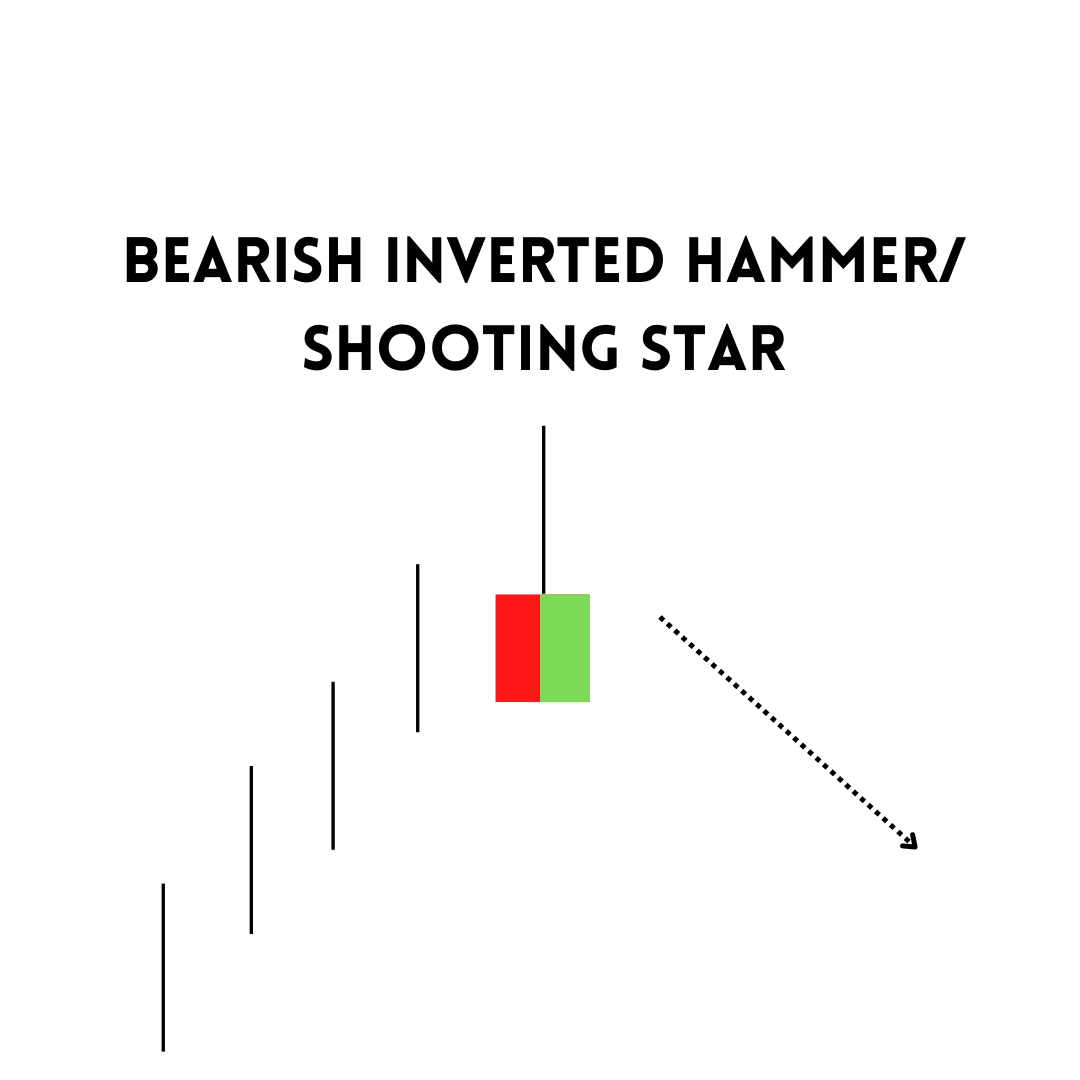
Bearish inverted hammer, also known as a shooting star.
Hammer Candlestick Trading Strategies
We’ve seen the most popular forms of hammers, but why is knowing them so important?
We’ve often pointed out that the most critical function of this type of candlestick is signaling a reversal: you can use this candlestick in many trading strategies, and every time you see them on a chart, they can tell you more than you might think.
Let’s see the most popular strategies that involve the different hammers.
Strategy 1: Top-Bottom Strategy with Hammer
Since hammers are mainly found at the end of trends and waves, many traders use strategies that involve these zones to choose entry and exit points.
The top-bottom strategy involves localizing a low confirmed by a hammer, using it as the entry, then taking profit when another hammer ensures the top.
To better illustrate this strategy, let’s have a look at this price chart that shows the crypto pair formed by Bitcoin and Tether:
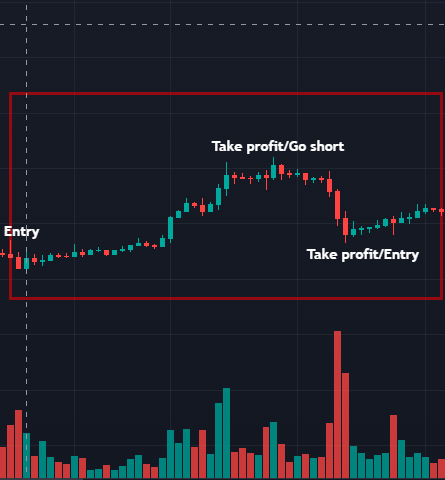
BTC/USDT 3-hour chart. Binance. Source: TradingView
Strategy 2: Support-Resistance Trading
Traders and investors know that resistance and support zones are great allies in trading strategies, and the very nature of hammers makes them very suitable for these zones. Think about that: an inverted hammer at a downtrend tells you that even if buyers and sellers are testing the market, one of the two categories didn’t allow the other to exceed a certain price level. This is precisely what happens with support and resistance areas.
The support-resistance trading strategy consists in finding support and resistance zones to choose either entry or exit levels and using hammers to set the specific price at which the trader buys or sells an asset.
Strategy 3: Intraday Trading with Moving Average
Traders often use moving averages to understand trends and their strengths. Especially when using intraday strategies, one of the most popular moving averages is the EMA (Exponential Moving Average) because it can react to price changes faster.
In short, traders check if prices are moving above or below the EMA to understand if the market is up or down. This strategy, combined with the use of hammers, helps traders to spot possible reversal points – as you can see in the image below:
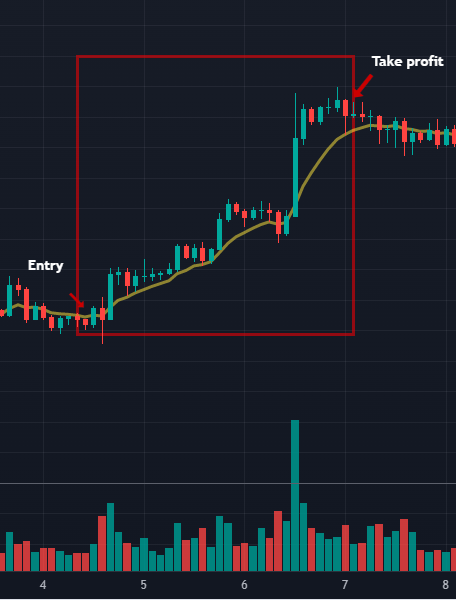
BTC/USDT 2-hour chart. Binance. Source: TradingView
Hammer vs. Doji: The Differences
The first difference between hammers and Doji is their shape: while hammers have a small body and one wick – this is not a rule, you can find a second but very short shadow, Dojis have almost no body and very long wicks.
So, the main feature of Dojis is that the opening and closing prices are close, which tells a lot about the behavior of traders and investors.
While hammers still show you some clear intention – buyers and sellers are fighting, but you can still foresee who will win, Dojis show extreme uncertainty.
Of course, there are some other elements to consider: for instance, as Nison reports in his Japanese Candlestick Charting Techniques, Dojis are more reliable when they call tops than bottoms. In the second case, they need some other confirmation – for instance, a hammer that further supports or changes the results you might expect.
Dojis can work as reversal or continuation patterns, while hammer candlesticks are mainly reversal points – at least in the short run.
The Pros and Cons of a Hammer Candlestick
Like any other candlestick, the hammer has both advantages and disadvantages.
Among the advantages we can list:
- The hammer is pretty easy to spot;
- You can usually find it during the same “places” – especially at the end of a trend or in support and resistance zones;
- Since hammers are usually found in specific zones, traders use them to set stop losses and take profit orders during their spot trading activities.
The disadvantage is that you can’t take it as a pattern that always works. In technical analysis, no patterns have 100% success, and the mistake that many traders make is to think that a single pattern can tell them everything about the market.
The Limitations of the Hammer Candlestick
The limitation of the hammer candlestick is that it might not signal a long-term new trend but only a temporary change in the movement.
As Anna Coulling often says, technical analysis is not a science, it’s an art: traders and investors can improve their capabilities by practice and experience to know what a candlestick is telling you. You should wait for more confirmations when you’re unsure about the future behavior of prices – especially when it comes to candlesticks like the hammer, which mainly works as a reversal signal.
Moreover, you should contextualize the pattern: as we said, you shouldn’t assume that a new trend is coming just by the color of the hammer, but you should look at its position and understand which share of the market is involved by using volume.
The Bottom Line
Hammer candlesticks are very useful to traders since they allow them to use many strategies and be precise enough when deciding when to buy and sell.
This kind of analysis can be profitable, especially in fast markets like the crypto market, which constantly changes and makes it hard for traders to decide when to enter the market.
Despite this, patterns do not always work as expected: any analysis requires discipline, knowledge, and the capability to look at the big picture, and hammers make no exception.
Related


Stay tuned
Subscribe for weekly updates from our blog. Promise you will not get emails any more often.
Our authors

Most Popular
New Posts
Stay tuned
Subscribe for weekly updates from our blog. Promise you will not get emails any more often.
Our authors


