
We covered many indicators and other trading tools in a series of articles in our blog. We’ll continue doing so in this piece dedicated to wedge patterns. As previously mentioned, crypto trading borrows much from the stock market and forex trading. The tools developed in those sectors proved to be instrumental in helping crypto traders to maximize profits and prevent losses.
Wedge patterns are not an exception. In many instances, wedge patterns help detect trend reversals, crucial moments for those who make money through long and short trades. Learning what wedge patterns are and how to use rising and falling wedge patterns can significantly help you to decrease market unpredictability.
What Is a Wedge Pattern?
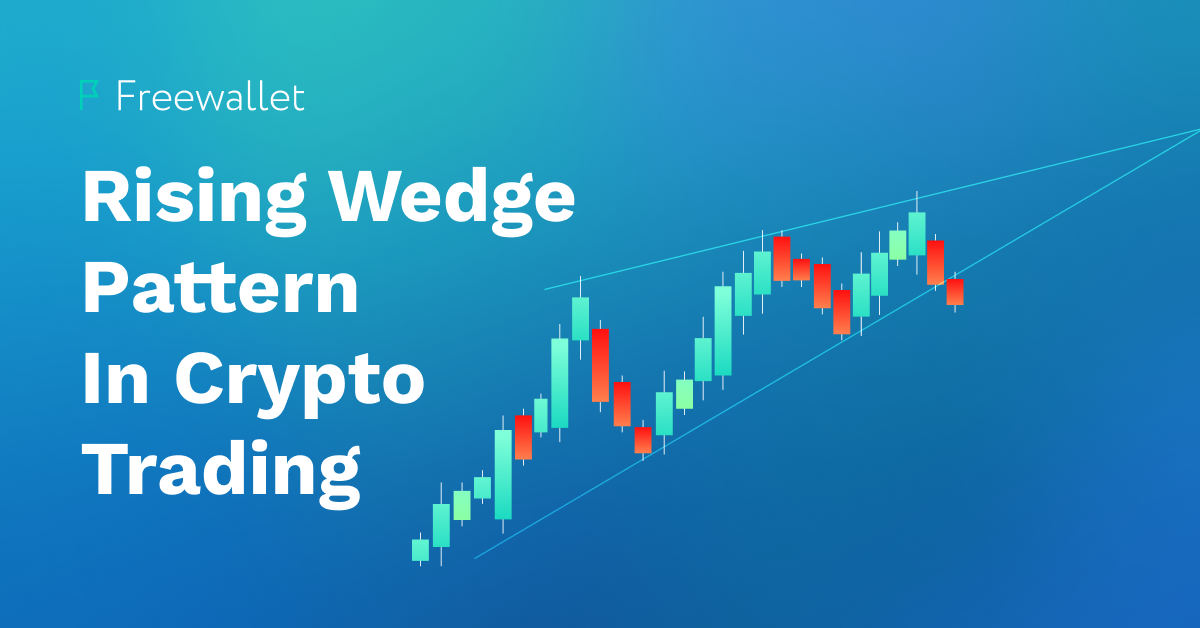
Before we speak about the rising wedge pattern precisely, we’ll provide a wedge pattern definition. A wedge pattern is a specific market trend spotted on the charts graph. It combines a price range going narrow with a descending (falling wedge) or an ascending (rising wedge) trend. The trend extremes make up a segment known as the wedge formation. In such parts, trades appear as converging lines creating the pattern. The formation of the pattern takes up to four weeks. Depending on the slant, the pattern might be rising or falling.
In the introduction, we have mentioned that wedge patterns can signal trend flips. In the wedge pattern, the support and resistance lines narrow with the pattern. The trend will likely change direction when the price reaches the resistance or support level. The gradual shrinking of the price volatility amplitude can signal the upcoming trend change. As cryptocurrencies are equally popular and volatile, wedge patterns occur frequently. Swing traders use rising wedge formations to predict when to post proper orders.
What Does a Rising Wedge Indicate?
A rising wedge is a pattern in which the high and low extremes keep expanding. It’s important to note that the support line’s ascension angle is sharper than the angle of the resistance line, meaning that the higher lows are rising faster than the higher highs. The rising wedge usually means a soon uptrend reversal (if it takes place after an uptrend) or a downtrend continuation (if it takes place after a downtrend). Often a rising wedge coincides with a trading volume drop. The narrowing is caused by the gradual shift from a bullish to a bearish trend (or the return and continuation of the bearish trend).
If you are waiting for the price to rise, you should pay attention to the higher trend line. However, in general, rising wedges indicate a downtrend. You can also make use of falling wedges. When some traders see that the falling wedge formation is taking place, they already expect the price to go down before the support and the resistance lines will cross.
Lower extremes characterize the falling wedge pattern. The support and resistance levels in the falling wedge go down, with the resistance slope at a sharper angle. In contrast to the rising wedge pattern, the falling wedge is a bullish signal in the increasingly weakening downtrend.
Spotting a Rising Wedge Pattern on a Crypto Chart
Learning how to detect the wedge pattern on the chart and identify it correctly is important. This skill might significantly improve the overall trading returns. More than that, if you try to use rising wedge patterns and do it wrong, you will lose a lot of money. The mistakes are costly, so it’s better to understand this strategy correctly.

For instance, in the picture above, you can see the case when the BTC price drop was predictable for those knowing how to use wedge patterns correctly. This pushback wasn’t a big issue for long-term investors, as we all know the vast Bitcoin rally unleashed in 2021. However, those who hoped to make money in June 2019 and lost their investment faced severe disappointment.
Confirming a Rising Wedge Pattern
If you see an oscillating chart segment with a sharp bottom slope and a stiffer higher line, it’s probably a rising wedge pattern. But how do you make sure it really is?
Some consider that if the price touches the support and resistance lines at least twice each, the wedge pattern is confirmed. If the price reaches one of these levels three times, it is enough for some to validate the pattern as a wedge.
How to Trade with a Rising Wedge Pattern
Considering the pattern shape, the price fluctuations get less significant as time goes on. The entry trade price level and the stop loss price are not as high as at the beginning of the pattern. Therefore, to maximize the profit, you should post a stop-loss order as close to the beginning of the trade as possible. Anyways, without the use of stop losses, wedge pattern-based trading may be too risky.
Limitations of the Pattern
Although the rising wedge pattern is one of the traders’ favorites among chart reading tools, it doesn’t go without shortcomings.
The biggest issue with the rising wedge pattern strategy is that the pattern can be hard to identify correctly. The rising wedge pattern can develop quickly at any given period of time. You can spot it when the circle is finished, but at the moment of its formation, one might miss the right time to identify this pattern and react appropriately. The usage of this pattern requires fast reaction and decision-making.
If you mistake a different pattern for a wedge, you risk losing your investment or wasting an excellent opportunity to earn more. Reading wedge patterns is a complex task. It is easy to confuse the wedge pattern types with each other. For instance, a rising wedge pattern can be mistaken for a pennant pattern or a flag pattern. Such errors in the analysis lead to missed opportunities or even outright losses.
What’s worse, even the correctly identified wedge pattern doesn’t determine the future. Note that the prediction accuracy of the rising wedge is not absolute. It gives a false positive result in nearly 33% of cases. You should use it combined with other indicators. If several tools give you similar results, you have a higher chance of success. If other indicators do not confirm the prediction results based on the wedge pattern, you should avoid risking much money.
Conclusion
Okay, let’s resume what we have learned from this article. The rising wedge pattern is usually a weeks-long upward pattern with prices oscillating between two slopes. The down one has a sharper angle than the top one. In the rising wedge pattern, the higher lows grow faster than the higher highs.
This pattern can occur after the uptrend and grow into a trend reversal. Alternatively, it can be a sign of the downtrend continuation. In any instance, it indicates the bearish market is coming soon.
The rising wedge pattern is a popular indicator although reading it correctly is challenging. Mistakes in using this pattern can be costly, so it’s important to use it together with other analysis tools and make sure that different indicators confirm the forecast. It’s fair to say that this advice can be given about any indicator. None of them is so perfect that traders can trust them independently from the data retrieved via alternative methods.
To prevent losing money to false positive rising wedge patterns or mistakes in identifying these patterns, traders can be advised to use stop-loss orders while performing price reversal-based trading.
Despite the possible difficulties in using this pattern, the strategies based on the rising wedge pattern are pretty popular. The pattern is considered one of the most popular price reversal prediction tools.
Related


Stay tuned
Subscribe for weekly updates from our blog. Promise you will not get emails any more often.
Our authors

Most Popular
New Posts
Stay tuned
Subscribe for weekly updates from our blog. Promise you will not get emails any more often.
Our authors


