
Candlestick patterns provide clues about future market trends. Experienced traders leverage these patterns to execute well-timed trades and optimize gains during both bear and bull phases. Several patterns have dual versions – one bearish and the other bullish. Bearish patterns occur during uptrends, indicating an imminent reversal to a bearish market. On the other hand, the bullish versions of these patterns appear inverted and signify the onset of an uptrend during a bearish market.
This article delves into the bear flag pattern, specifically, a bearish variant that signals an impending price decline during a bull run or the continuation of the bear market. It explores the advantages and risks associated with utilizing the bear flag pattern, highlights the disparities between bear and bull flag patterns, and offers guidance on trading using the bear flag pattern.
What is the Bear Flag Pattern?
While some may perceive the bear flag as a signal of trend reversal, it is typically considered a continuation pattern or at least an indication of an impending slowdown at the conclusion of an uptrend.
Similar to other candlestick patterns, the bear flag has been relevant long before the advent of cryptocurrencies, proving its applicability to this sector. Unlike traditional markets, cryptocurrency trading operates 24/7, introducing certain specificities.
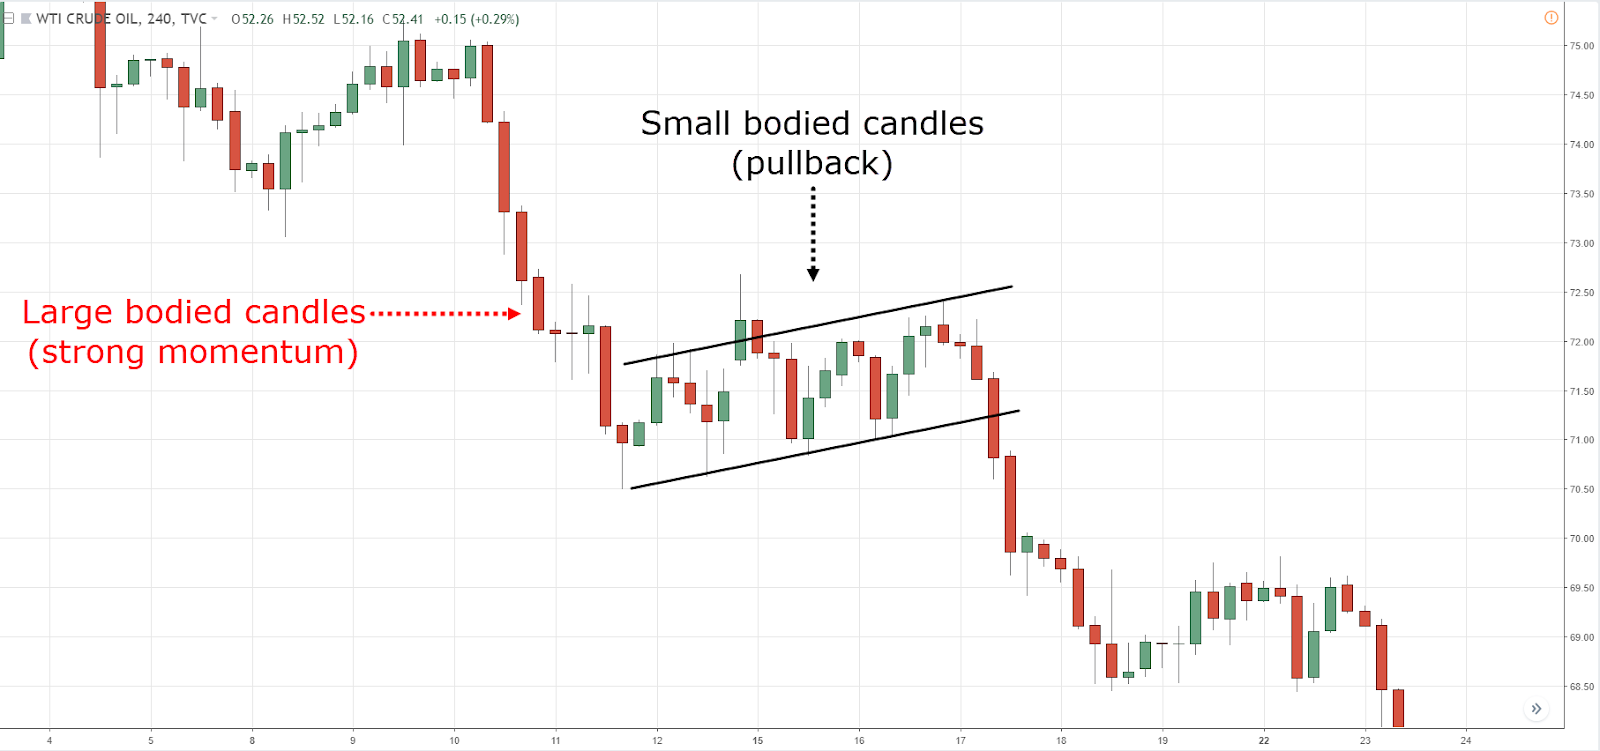
Image source: TradingwithRayan
In cryptocurrency trading, the bear flag pattern emerges at the conclusion of an uptrend or amidst the bear market. It is formed by two price declines and a brief consolidation period between them. The bear flag pattern develops rapidly, making it easier to identify when using lower time frames.
The “flag” section follows the formation of the “flagpole,” which resembles a swift downward price movement – a sequence of successive red candles, each opening and closing lower than the previous one. It can be likened to a steep nosedive in prices.
Following the formation of the flagpole, the price rebounds. As panic selling gives way to profit-taking, prices rise, elevating both the highs and lows. These converging peak and bottom trend lines form the flag pattern. The price continues to ascend until it encounters the resistance level, subsequently dropping to a level close to the opening price.
How to Confirm the Bear Flag Pattern?
Mistakes in identifying patterns can lead to losses; hence, it is crucial to confirm the pattern before placing orders. Several checkpoints should be considered when identifying the bear flag pattern. These checkpoints not only confirm the pattern but also indicate its reliability.
- Volume: The significance of volume in identifying and confirming the bear flag pattern cannot be underestimated. Low trading volume during the consolidation period signifies increased risk, as bulls may overturn the pattern and prevent the price from declining. To authenticate the bear flag pattern, it is essential to ascertain whether trading volume is high.
- Duration: The length of the pattern directly affects its reliability. A longer pattern is generally more dependable. If the bear flag forms over a short period, both bears and bulls may miss the opportunity to take the necessary actions for complete flag formation. This can result in false breakouts or breakdowns. A prolonged pattern may indicate reduced trader interest, diminishing the predictability of the outcome.
- Market Overview: The overall context significantly influences the reliability of the bear flag pattern. A clear downtrend provides the ideal conditions for forming the most dependable bear flag pattern. In contrast, a bear flag occurring during an uptrend or consolidation is less reliable. Additionally, fundamental factors play a crucial role in bear flag formation.
How To Trade the Bear Flag Pattern?
There are multiple ways to apply the bear flag pattern in crypto trading. When the bear flag emerges in a downtrend, it signals a continuation of the market trend. In such scenarios, placing a sell stop order below the flag level is prudent. If the trend breaks the upper level of the flag, a buy stop order can be positioned above this higher level. This strategy effectively captures both trend lines with stop orders, ensuring that no profit opportunities are missed.
During an uptrend, the bear flag pattern indicates a potential trend reversal and the beginning of a bear market. In this case, a sell stop order can be positioned below the rising trend line at the price immediately after the sharp decline and before the subsequent rebound. Meanwhile, a stop-loss order is set above the upper trend line at the price during the rebound.
Implementing a stop-loss order is essential to mitigate the risk of potential losses if the price unexpectedly surges. Such unexpected market movements could be triggered by news events or social media influence, as seen with instances such as Elon Musk’s tweets about Dogecoin or viral Dogecoin-themed TikTok videos. Having a stop-loss order in place adds a layer of protection against such unforeseen developments.
The time required for a stop order to execute may vary based on price volatility, influencing the breakout moment of the pattern. If the bear flag is identified on the one-hour or smaller timeframe, the order is typically executed within a day. Conversely, traders utilizing four-hour and longer timeframes (up to one week) may see their orders filled over a span ranging from several days to several weeks, depending on the market conditions.
Another strategy involves shorting crypto during the pullback just before the next downturn. This approach demands early pattern recognition and entails slightly higher risk.
Despite the widespread recognition and clarity of the bear flag signal, confirming the signal using technical indicators is advisable. RSI and MACD are among the most frequently used indicators for confirming the signal. We have reviewed RSI in the respective article earlier and introduced other tech indicators in the blog post about technical analysis in crypto trading. Due to the high volatility of cryptocurrencies, risk management is especially critical in crypto trading.
Benefits and Risks
In general, both the bear and bull flag patterns are deemed reliable signals, offering traders clear entry points. However, employing the bear flag pattern entails certain risks. We will explore the pros and cons of this candlestick pattern below:
Benefits:
- The bear flag pattern facilitates identifying optimal buying opportunities and determining stop-loss levels.
- It presents a favorable risk-to-reward ratio, indicating a lower likelihood of failure compared to the potential positive outcome.
- The pattern exhibits distinct characteristics, aiding its accurate identification on the chart.
- Another advantage of the bear flag pattern is its suitability for all timeframes, catering to scalping, day trading, and swing trading strategies.
Risks
- For novice traders, the complexity of the bear flag pattern can be daunting. Spotting this pattern without skill can be challenging. The bear flag is relatively rare, making false identifications possible, thereby increasing the risk.
- At times, the pullback may not lead to a subsequent price drop. This occurrence is often attributed to fundamental factors influencing price surges. Nevertheless, trading patterns are not foolproof and may not be 100% accurate.
Bear Flag vs. Bull Flag
The bull flag is the mirror image of the bear flag. While the bear flag comprises a price decline (flagpole), pullback (consolidation), and another decline (the flag), the bull flag involves two price spikes and a consolidation period of downward movement between them.
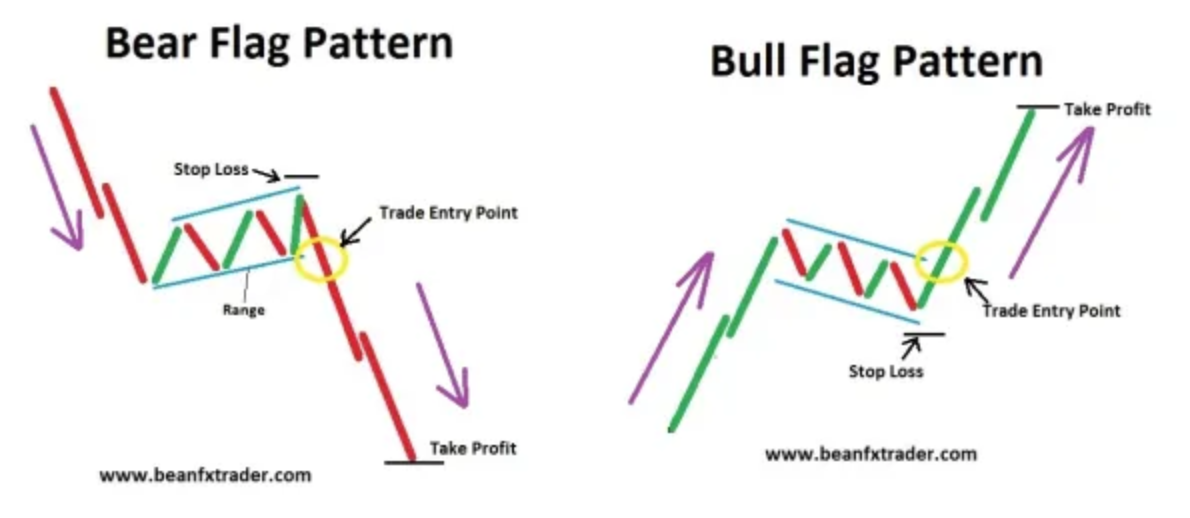
Image source: FX & VIX Traders Blog
Typically emerging in a downtrend, the bull flag signals a reversal to a bullish market. Similar to the bear flag, the bull flag can be utilized for both short and long trading. In a bullish market, the bull flag acts as a continuation pattern. Both the bear and bull flag patterns are deemed reliable signals.
Conclusion
The bear flag serves as a dependable pattern, signaling an impending price decline and aiding in identifying the optimal moment to place an order. It has proven to be beneficial for traders implementing various strategies involving both short and long positions.
This pattern offers a favorable risk-to-profit ratio, making it a robust risk management tool. However, exercising caution is imperative to avoid potential losses, even when the bear flag is identified. The use of technical indicators and attention to fundamental factors can provide valuable assistance.
Related


Stay tuned
Subscribe for weekly updates from our blog. Promise you will not get emails any more often.
Our authors

Most Popular
New Posts
Stay tuned
Subscribe for weekly updates from our blog. Promise you will not get emails any more often.
Our authors


