

Modern crypto exchanges provide users with multiple indicators. These indicators help to understand the current market trends better. Therefore, the correct use of graph tools can improve an overall trader’s performance. These indicators were developed long before the emergence of cryptocurrencies and were used for stock and forex markets. However, after the crypto trading boom, indicators like RSI became widely introduced to a new audience.
In this article, we will review one of the most popular indicators, the Relative Strength Index, or RSI. You will learn the difference between RSI and another popular indicator called MACD. On top of that, we will tell you how to use RSI, what is a bad RSI number, what RSI divergence is, learn the RSI formula, and other crucial facts about this indicator.
What is RSI?
In technical analysis, RSI indicates an asset’s momentum. Based on the recent price trajectory, RSI shows if the coin is overbought or, rather, it is oversold. On top of that, RSI indicates if the asset is on the brink of changing its trend. This info helps to understand when you should sell or buy an asset in question.
RSI uses the momentum oscillator graph. John Welles Wilder Jr. introduced the momentum oscillator graph in his innovative work called New Concepts in Technical Trading. The book was released in 1978. This graph shows the price oscillations between the extremes on the 100-point scale. The momentum oscillator graph and the unique formula reveal if the asset is overbought or oversold.
To get the correct relative strength index, you should use the following formula: RSI = 100 − (100 / [1 + average gain / average loss]). In this formula, RSI is the relation between the average incomes in bullish periods and the average losses in the periods of price decline. If the valuation doesn’t exceed 30, the asset is regarded as oversold. It is usually interpreted as a buy signal. If the valuation is 70 or more, the asset is overbought (a sell signal). Normally, you don’t have to use the formula yourself, as exchanges supporting RSI provide automated RSI valuations and graphs.
What Is RSI Divergence?
Speaking about RSI we should mention such a term as the price divergence. The divergence is when the price breaks to a new level (it can be a new high or a new low), but the RSI line doesn’t reflect it. In the case when the price reaches a new maximum valuation while RSI shows a new low, it is called a bearish divergence. Traders usually consider it as a sign of momentum fading. That’s a sell signal. The start of the bearish trend is just around the corner. The bullish divergence occurs when the price hits the new low while RSI doesn’t reflect it and keeps going up. Some consider it a time to buy assets and the bull market significator.
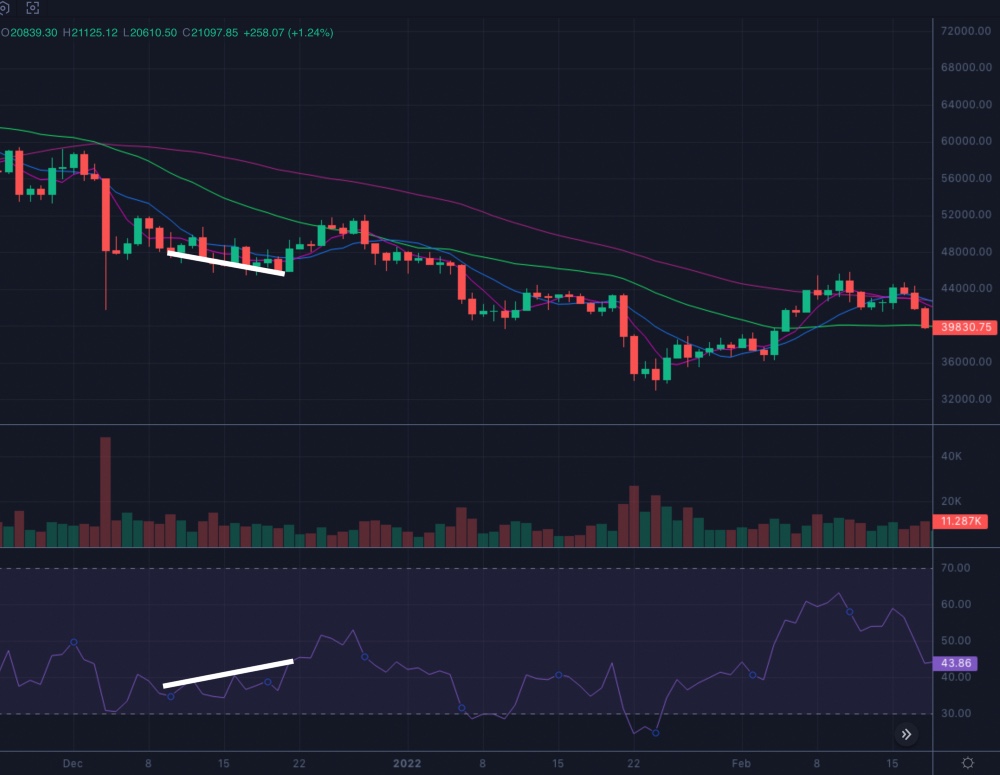
The picture above showcases an example of the bullish RSI divergence. The price in the graph reaches a new minimum while the RSI line reaches new maximum points during the same period.
For more comfort, you can find RSI divergence cheat sheets on the Internet. It helps to interpret the RSI valuations in different trends quickly. However, it’s better to make sure first that the sheet you choose is the right one.
How to Read RSI?
Now, let’s see how to read RSI and use this indicator in crypto trading. As for the RSI specifics in crypto trading, we can’t say that there is anything special about the use of this indicator in crypto. The crypto market itself is more volatile than the stock markets. So, RSI is even more useful there.
You can find numerous buying and selling opportunities while reading RSI. For instance, it’s time to sell when RSI hits 70 or more. Or you can also sell in a bearish trend when the valuation is between 30 and 50 points. Another right moment for selling what you have is a bearish reversal point when the bearish divergence takes place.
If you are looking for buying opportunities, you can buy when the RSI drops to 30 or goes below this value. In a bullish trend, you can buy when the RSI line is somewhere between 50 and 70. When you see the bullish divergence in a bullish reversal, it is also time to buy.
Downsides of RSI
There is no doubt that RSI is very useful. Nevertheless, trading is a complex process, and you won’t find a universal “magic” tool that will solve all your problems in a blink of an eye. There are some reservations about using RSI, and you should be aware of them.
Most notably, RSI is suitable for long-term trends but is not that accurate on a short distance. Therefore, reversal signals should be taken with a grain of salt. Often the RSI’s trend reverses indications end up being false.
More than that, without combining it with other indicators, RSI can’t be a great advisor. It shows if the asset is oversold or overbought. But to decide how to react to this information, you should better use additional analysis tools.
RSI vs. MACD
RSI is not the only trend-following extremes indicator. The moving average convergence divergence (MACD) is a similar popular indicator. MACD showcases the two moving averages ratio of the asset’s price and is based on a different formula. Like RSI, this indicator’s valuation is expressed in line form.
MACD is the difference between the 26-period exponential moving average (EMA) and the 12-period EMA. Traders call a nine-day EMA period a signal line. It is put over the MACD line. When MACD goes higher than the signal line, it’s a buy signal. They sell the asset when the MACD line goes below the signal line.
RSI and MACD complement each other very well, so traders often use these indicators together. A combination of RSI and MACD gives a more precise picture letting traders decide whether to buy or sell and predict the asset’s momentum correctly. However, sometimes indicators can give different signals simultaneously. In such cases, traders should decide which one they trust better.
FAQ
What does RSI stand for?
RSI is an acronym. It means “relative strength index.” This tool helps to indicate the asset’s momentum and see if it’s oversold or overbought. With RSI valuations from 0 to 100, traders can conclude whether it’s time to buy or sell the coin.
What is a Bad RSI Number?
There is no bad or good RSI number. As you can see from the previous chapter, everything relates. If you want to get rid of the asset, the bad number will be somewhere around 30, which indicates that the coin in question is already oversold. If you are going to buy an asset, then the bad number is 70 or higher. You will have to wait until the RSI goes lower.
Should I buy when RSI gets low?
It would help if you didn’t rely solely on the RSI valuations, especially if you don’t pay attention to the context. The same valuations can have different meanings depending on the trend and price divergence. You may think that RSI below the 30-point level is a buy signal. But if the downward trend turns out to be continuous, buying an asset will not be the right decision. It’s better to double-check your prognosis using other indicators.
Should I sell when RSI is high?
A high RSI is usually interpreted as a sell signal. However, just like in the previous case, it’s better to see what other indicators tell first. If the asset continues to be overbought, you’d better hold on for a clearer sell signal.
Related


Stay tuned
Subscribe for weekly updates from our blog. Promise you will not get emails any more often.
Our authors

Most Popular
New Posts
Stay tuned
Subscribe for weekly updates from our blog. Promise you will not get emails any more often.
Our authors


