
Bollinger bands are among the most widely used technical indicators in trading, but it’s not always easy to read them and fully understand what they represent.
In this article, we’ll cover this topic in depth, so to give you all the information you need if you want to start trading crypto using Bollinger band strategies.
What Are Bollinger Bands?
As mentioned, Bollinger bands are indicators that help traders set strategies to choose when it’s time to buy or sell.
The type of trading doesn’t matter; it can be futures or spot trading. Any trader develops specific strategies and might want to use different indicators – or mix them – but the first step is always knowing what each indicator represents.
In this case, Bollinger bands signal the level of market volatility for a specific asset.
It will be easy to find them since they’re integrated with all the leading trading platforms, so let’s see a practical example.
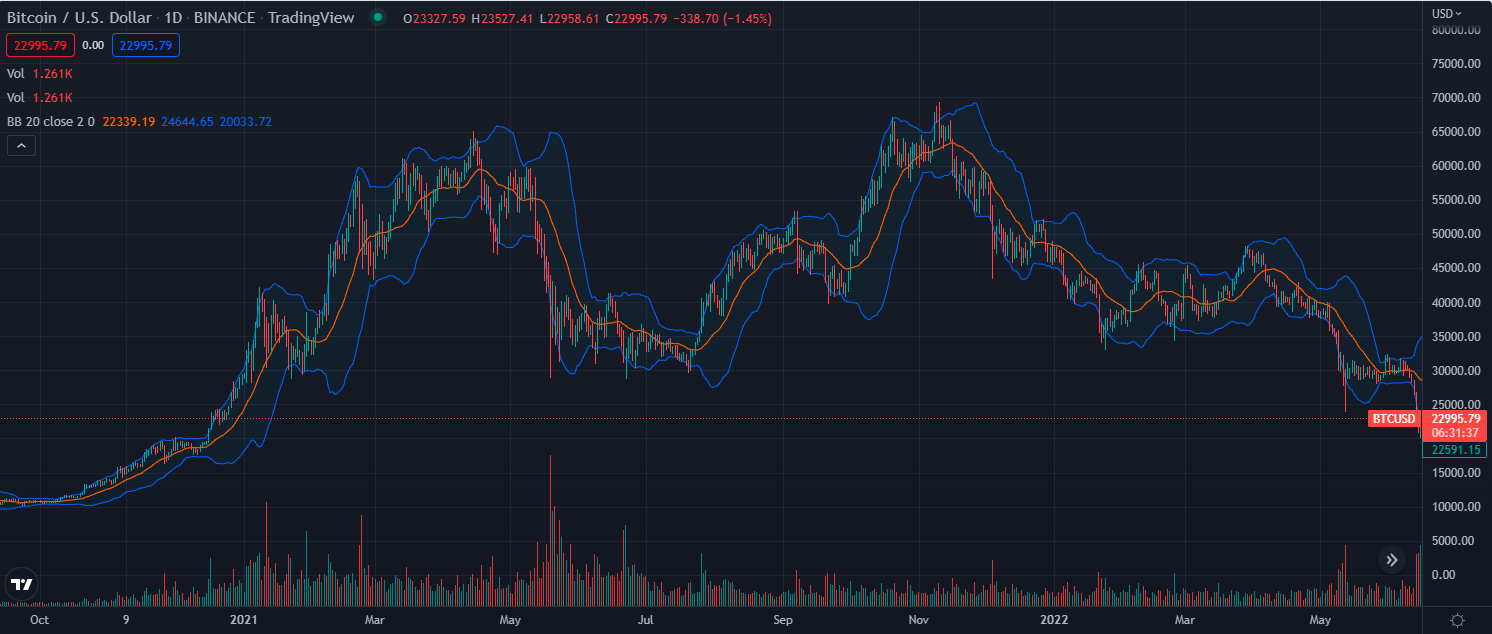
Source: TradingView
The image above shows a Bollinger Band chart where we used bands to assess the level of volatility of Bitcoin’s price.
As you can see, there are three lines:
- The upper band: is usually set two standard deviations away from the middle line;
- The middle line: represents a Simple Moving Average (SMA);
- The lower band: usually set, as the upper band, two standard deviations away from the SMA.
So, the simple moving average works as the base for the other two bands, showing the price range during a specific period.
As mentioned, the upper and lower bands are commonly set two standard deviations away from the simple moving average, while the SMA is usually set to 20 days.
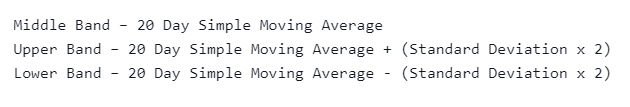
Source: TradingView
These are just the most popular and best Bollinger band settings, but traders can modify them according to their strategies and market developments.
The Bollinger Bands indicator was created by John Bollinger in the early ‘80, to make it easier to visualize volatility.
The way the Bollinger bands work makes this indicator fit the category of oscillators, which are all those technical indicators that consider ranges and not specific price levels.
But how to read Bollinger Bands? What can they tell you?
How Does The Bollinger Band Strategy Work?
You’ll see that Bollinger Bands become wider or narrow: they become wider when volatility increases and narrow when volatility decreases.
According to this information, traders set specific trading strategies that fit their needs. The strength of this indicator relies on its intuitiveness, which allows traders to save time trying to build ranges by themselves.
But this is not the only thing the bands can do.
Traders also use them to assess when an asset is overbought or oversold. To be more specific, the strategy works as follows:
- When the price of an asset is too close or even breaks the upper band, traders take it as a signal that the price is unnaturally high – that is, the asset is overbought – and it’s time to go short;
- On the other hand, when the price is close to the lower band or breaks it, the asset is oversold, and it’s time to go long.
In very general terms, this is how Bollinger Bands are used in trading.
But we need to consider that not all assets are the same and that it’s important to make different considerations for different markets.
In the case of crypto trading, you should read Bollinger Bands according to the different levels of volatility of this market when compared to traditional markets.
How Is The Bollinger Band Strategy Used In Crypto?
The Bollinger Bands trading strategy is also used in crypto trading, mainly because of the market’s high volatility.
In cryptos, having an intuitive way to analyze an intrinsic market characteristic like volatility is extremely useful for traders. They use Bollinger Bands also to identify new trends.
Actually, when the bands are close, they clearly identify sideways movements, but when they get wider, they identify not only higher volatility but also the price range within which a new trend develops.
In particular, some strategies can help traders to be even more precise when trying to forecast the possible behavior of prices.
Bollinger Bounce
The Bollinger Bounce strategy is pretty straightforward: traders use to buy when the price is close to the lower band and sell when it’s close to the upper band.
To make this point even more straightforward, let’s have a look at a practical example using the Polygon (MATIC) price chart:
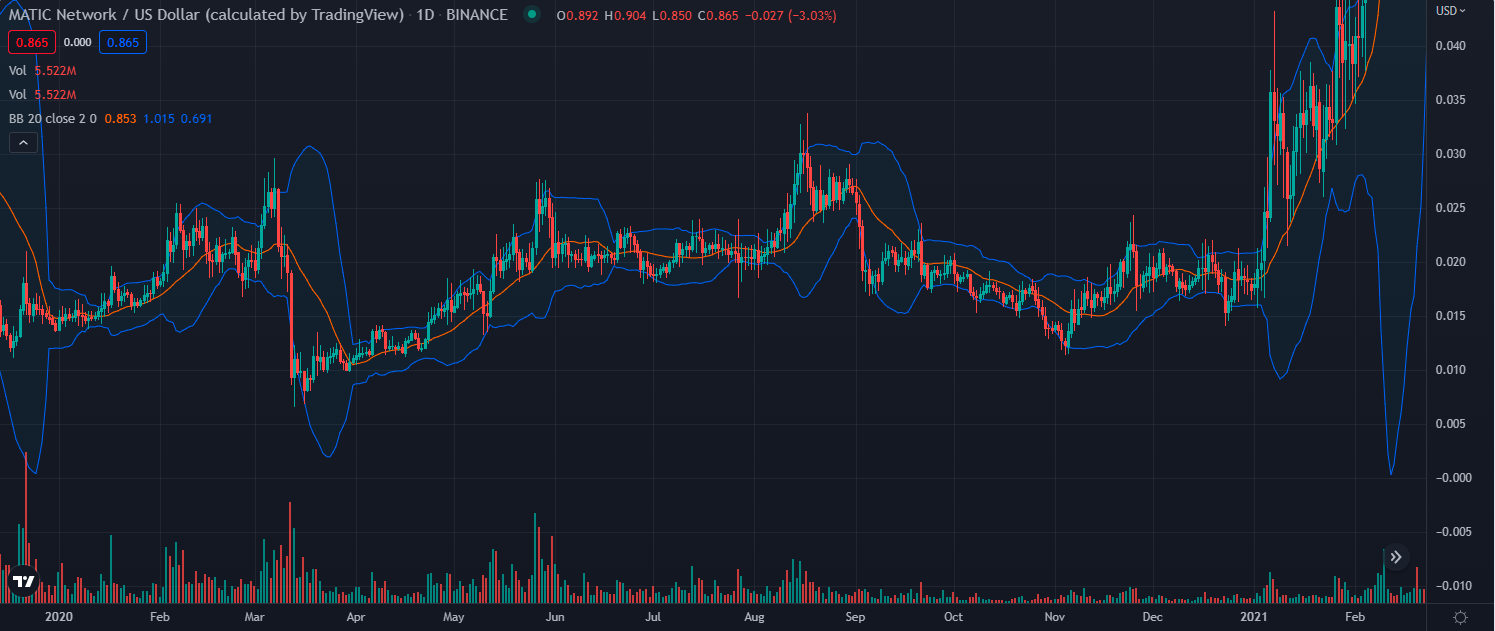
MATIC/USD price on Binance. Source: TradingView
The bounce strategy works when the range is sufficiently flat, so you can identify a sideways movement – like in the MATIC chart above.
But this is not the only crypto trading strategy that involves the bands.
Bollinger Squeeze
The Bollinger Bands squeeze is a particular trading strategy traders use to follow a trend.
It’s a little more complex than the bounce strategy. The squeeze consists in identifying a new trend thanks to Bollinger Bands: when the bands get wider, and there is a candlestick that breaks a band, traders use it as a signal that a new trend is about to start and that the sideway movement is over.
Let’s have another look at the MATIC chart:
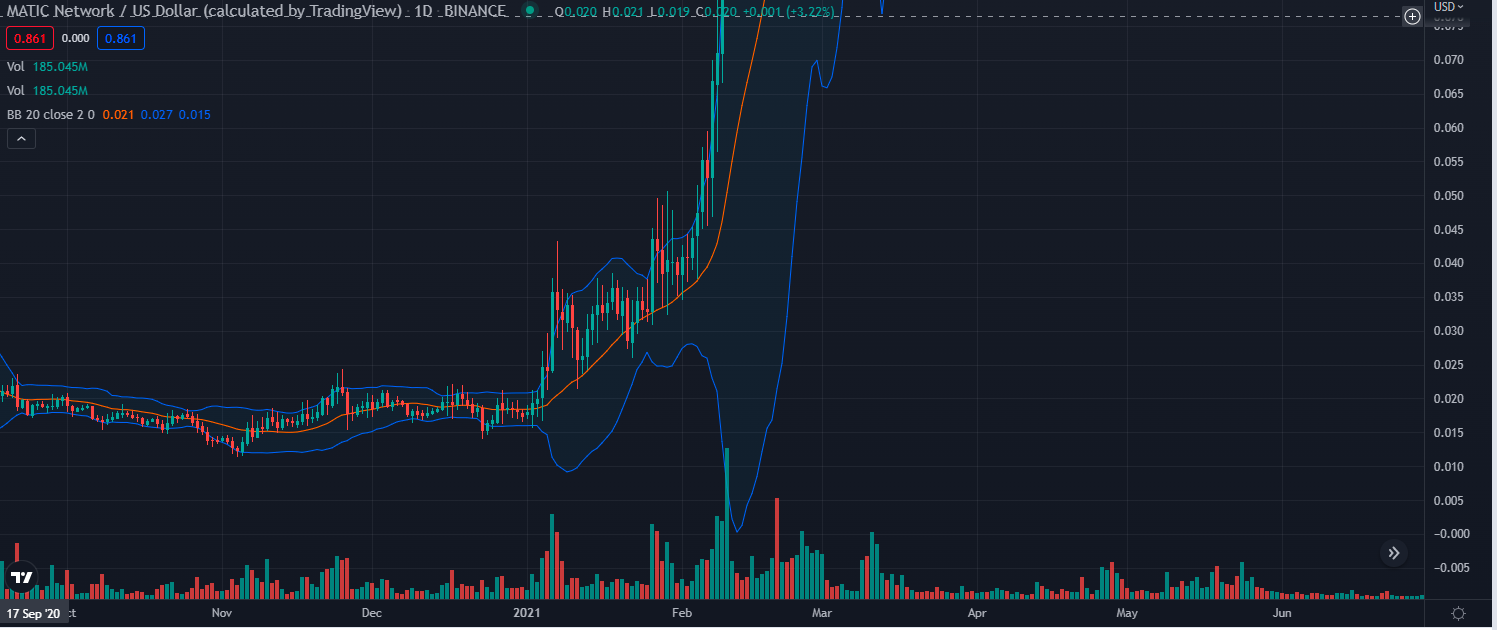
After the sideways movement, the bands get wider, and there is a candlestick that breaks the upper band. Observe volume: the trading volume supporting the candlestick is relatively higher than the previous bars, signaling a new genuine trend.
Observing volume is extremely important in these cases because it makes the difference between a new sustainable trend and simple FOMO.
Pros And Cons Of Bollinger Bands Strategies
What we said so far clearly shows that Bollinger Bands are a valuable indicator, but it has both advantages and disadvantages.
To start with the pros:
- They give you a visual representation of volatility that makes it easier to assess how the market is going;
- You can use them to set up and follow different strategies;
- They’re very popular: when it comes to investments, and especially to the crypto market, using popular indicators is important because this means that countless other traders worldwide are following the same reasoning, thus driving prices towards specific directions;
- Their popularity also allows you to find trading platforms that include this indicator quickly;
- Bollinger Bands have a simple structure, but this doesn’t affect their strength;
- You can use them on different timeframes;
- You can use them to analyze volatility and the possible start of new trends.
When it comes to disadvantages, the main con of this indicator is that you need to be able to set up the bands according to the specific market you’re investing in. In fact, technical analysis is more an art than a science: you need to analyze the behavior of an asset and assess if the most popular settings can work. Otherwise, you need to decide – for instance – to modify the length of the simple moving average to make it fit the market’s particular needs.
Moreover, these bands are more valuable for analyzing the current or very short-term market conditions – you can’t use them to try making longer-term predictions.
Conclusion
Bollinger Bands are a valuable tool: they’re included in the category of oscillators, particular technical indicators that utilize ranges instead of specific price levels. This gives you more opportunities to set your trading strategies and make profits, but they also require the capabilities to choose the proper settings.
In this article, we covered all the features of Bollinger Bands, the most popular settings and trading strategies, their importance in crypto trading, and their pros and cons.
In any case, you should always do more research before using a particular indicator to understand if it fits your trading needs and if you can deal with different settings if needed.
Related


Stay tuned
Subscribe for weekly updates from our blog. Promise you will not get emails any more often.
Our authors

Most Popular
New Posts
Stay tuned
Subscribe for weekly updates from our blog. Promise you will not get emails any more often.
Our authors


