
In decades, trading science produced umpteen pattern types. Some are simple, and you spot them easily as they have only a few visual characteristics. Other patterns are made of several distinctive elements following each other in a specific order. Although learning how to spot three-piece chart patterns can seem challenging, it can seriously improve your market performance, increasing your profits. Enhanced with the indicators optics, you will have a clearer understanding of where the price is heading at the given moment.
In this article, we will tell you about a complex indicator known as a pennant pattern. This indicator has three parts: continuation, consolidation, and then breakout. Like many other patterns, the pennant pattern can be bearish or bullish. We will speak about the bear pennant pattern in detail. Below you will learn what the bear pennant pattern is, how to boost your profits with it, and so on.
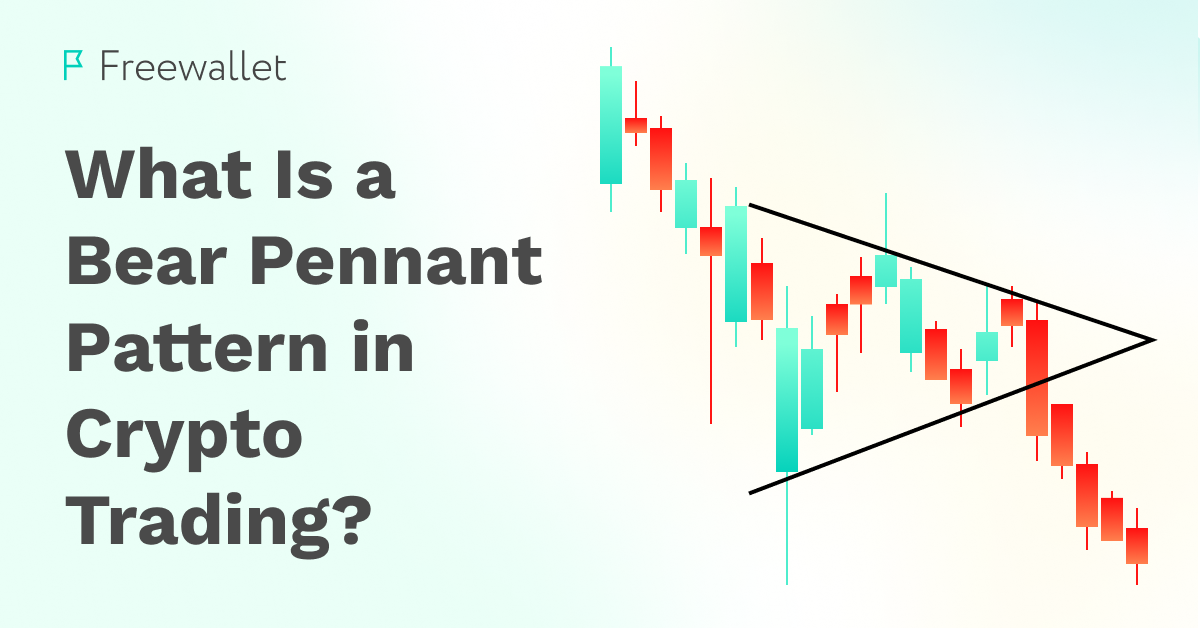
What Is a Bear Pennant?
The bear pennant is a three-piece chart pattern used in technical analysis. This pattern signals a further price decline after a downtrend. The first segment is a downward pole, a continuation pattern indicating the investors’ fear and uncertainty (FUD). In the pole phase, each new candle is placed lower than the previous one.
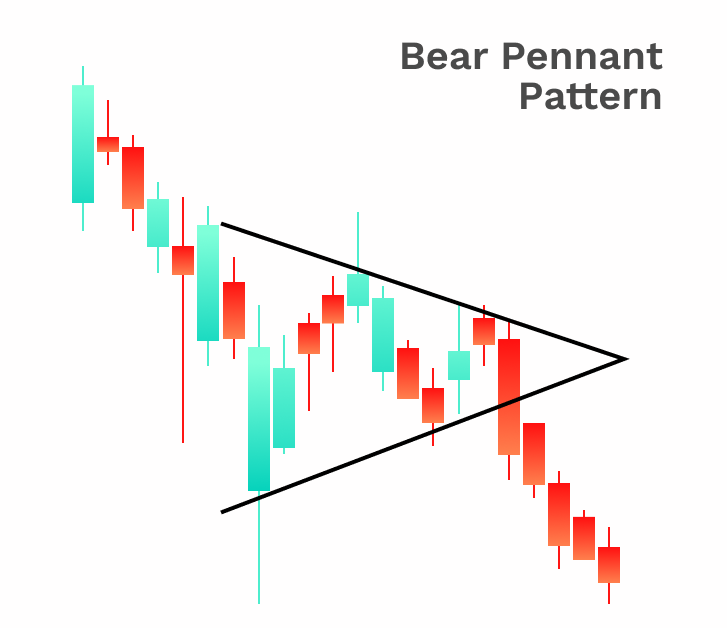
The second segment is the narrowing consolidation phase. During this phase, the price fluctuates, creating multiple green and red candles. The highs line is heading lower while the lows line is ascending. The point of the support and resistance lines convergence indicates the breakout. In the bearish pennant, it means that at this point, the price will start quickly plummeting.
The Bearish Pennant Pattern Phases
The reason behind the bear pennant formation is the strengthening of the skeptic sentiment towards the asset. Most traders feel reluctant to buy it, while others try to short it as soon as possible. No wonder the asset’s price quickly goes down soon after. This price move creates a pole, the first phase of the pennant pattern.
Some traders will deliberately try to tackle the price down during this period to buy the asset at the lower price shortly after. Others will stay bullish over the asset for whatever reason. Such activity will create a situation of uncertainty, signifying the beginning of the consolidation phase.
If the bearish sentiment persists and takes over the bulls, the consolidation period gradually passes to the breakout (a downfall in the case of the bearish pennant). The breakout takes place when the price goes below the support level. That’s when more traders begin to sell the asset due to a clear understanding that it won’t recover soon. It catalyzes the price’s nosedive.
Indicators to Confirm a Bear Pennant?
The pattern structure is one of many things to consider when identifying the pennant indicator. There are several additional signs to distinguish this pattern and not confuse it for other known indicators, like a flag pattern and so on.
One of the correct signs of the pennant pattern is that during the consolidation phase, the support and the resistance lines make up a nearly symmetrical triangle. If you see it, you are probably dealing with the pennant pattern.
The pennant pattern’s structure resembles the structure of an indicator called a “flag.” The support and resistance lines of the flag pattern’s consolidation phase are parallel. In contrast to this, the consolidation highs and lows of the pennant pattern clash at some point.
As this pattern has a complex structure, its formation takes many days to complete. Typically, the pennant pattern can develop in up to three weeks. The trading volume in the different segments of the pattern is not the same. During the consolidation period, the volume seriously decreases and then drastically surges after the breakout.
How to Trade with the Bear Pennant?
Just like other bearish indicators, the bear pennant prepares traders for the upcoming price downfall. Unlike the trend reversal patterns (like the butterfly pattern or others), the pennant pattern signals the continuation of the downtrend and the subsequent price drop. Most traders may see it as a future buying opportunity. They do it shortly after the breakout. Despite the distinctive characteristics of this pattern, it’s always better to confirm it using other indicators. No indicator can do a 100% accurate job.
Some traders use the relative strength index (RSI) lines to make sure they deal with the bear pennant pattern. In the consolidation period, the RSI lines are expected to narrow, and the asset will get overbought. Post-breakout price usually comes with a new resistance level.
The point where the price goes below the pole support line is a short entry position (the end of phase one). The end of the consolidation phase is time to post a stop loss order above the upper high level. This moment is signed with the convergence of the support and resistance lines.
Calculate the price difference at the beginning and the end of the first phase. The amount you get can be used as a profit target after the breakout. If the price has dropped by ten units, you can place a profit target of 10 units below your trade entry.
Another possible strategy is to wait until the price begins to crumble during the consolidation phase. As it breaks down to a new support line, wait for the rebound and place a sell order (short entry). The past support level will turn to a new resistance level. Then, post a stop loss at this level. The profit target is the same as in the previous example. It should be in line with the price difference between the beginning and ending phase one.
Pennant Patterns vs. Triangle Patterns
The symmetrical triangle can serve as a trend reversal signal, something that doesn’t characterize the pennant pattern, which is the continuation pattern. Another considerable difference is that the pennant pattern occurs after a substantial price drop or growth and can’t happen in other conditions. The symmetrical triangle can be spotted in any market condition. That’s what makes it different.
Limitations of the Bear Pennant Pattern
Just like any indicator, the bearish pennant can turn out to be a false positive. To avoid mistakes (and related losses), you should always confirm what you got from the pattern using other signals/indicators. If the results contradict each other, it’s better to wait for a more precise moment.
Another drawback is that the ranges you get from the pennant pattern are inaccurate. It causes traders to use extensive stop-loss orders, which is not a nice thing in terms of risk management.
All in all, precision is not the pennant’s characteristic. However, we might add that no indicator will give you an accurate signal, and you should always be prepared for the alternative scenario.
The Bottom Line
Spotting such a vast, long-lasting, complex pattern can be tricky for traders with little experience. However, learning how to do that is important to enhance your trading skills. Intuition might be a good thing but relying on the tools that withstood the time test is a much better decision.
The pennant pattern gives you a vision of the future direction of the price. However, this indicator is not as precise as you would probably wish. Combining it with other indicators will help you to narrow your prediction zone.
As you have learned, the bear pennant provides a variety of trading strategies that can be applied in the respective market situation. It shows that continuation patterns can be as helpful and diverse as the trend reversal signals.
Related


Stay tuned
Subscribe for weekly updates from our blog. Promise you will not get emails any more often.
Our authors

Most Popular
New Posts
Stay tuned
Subscribe for weekly updates from our blog. Promise you will not get emails any more often.
Our authors


