
Some trading patterns are complex and hard to identify, while others are somewhat elementary. The latter can often be the parts of the former. Nevertheless, simple patterns can have meaning in their own right.
The pattern we will observe in this article is one of the most straightforward trading patterns. It is called a doji candle. Doji is not hard to spot as it’s just one candle without a body. It looks like a cross, plus sign, or an inverted cross. The open and close prices are the same.
Traders usually read doji as a reversal signal. However, this pattern can also signify upcoming market indecision. Please read this article to learn what a doji candlestick pattern is, how to trade with it, and how doji is different from another simple pattern called a hammer candle.
What Is a Doji Candlestick Pattern?
A doji candlestick is a chart signal showcasing quite an unusual situation when the open and close price of the session is the same. The word “doji” is Japanese for “the same thing,” meaning that two normally different prices coincide this time.
This situation causes the candle to be bodiless with only the wicks and a mark at the open/close price level. As the crypto market works 24/7, doji candlestick may occur depending on the scale of the chart. It can only partially coincide with the particular date. The position of the open/close price level mark on the wick is determined by the high and low extremes of the price. Sometimes, a doji candlestick can have a little body if the open and close prices are not entirely the same.
What Does a Doji Candlestick Tell Us?
Most traders see doji as a trend reversal pattern. There are other ways to interpret the doji pattern. Some see doji as a market indecision signal. It’s safe to say that you can’t tell that much from the doji pattern. Using it as a definite trend reversal or indecision pattern can be a mistake. Using more indicators to make the situation more straightforward is always better. It’s especially important to confirm your assumptions via other indicators after seeing a doji candlestick.
We can think that the inability of the current trend to develop (the price didn’t manage to break through the open price) is a trend reversal signal itself. Not everyone interprets the doji pattern this way, though.
Relying on the auction theory logic, we can say that the equality of the open and close prices signals the moment of indecision in the market. Both sellers and buyers are not sure at what price trades can be profitable. None of the parties takes bold action.
Another way to read the doji pattern is to see it as a market consolidation indicator that probably signals the continuation of the current trend. Even spotted in the consolidation periods, the doji candles can signal that the price is about to break out.
As you can see, the interpretations of the doji pattern are so different. They even contradict one another. If you learn the differences between the doji candlestick pattern types, you will probably find a way to use doji for good.
Types of Doji Candlestick Chart Patterns
Although this pattern can seem extremely simple, traders still recognize several different types of the doji candlestick pattern, and it’s important to distinguish one from the other. Doji candles have a shape of the plus sign, a cross (or T-shape), and an inverted cross. These shapes represent the respective types: a long-legged doji, a dragonfly doji, and a gravestone doji.
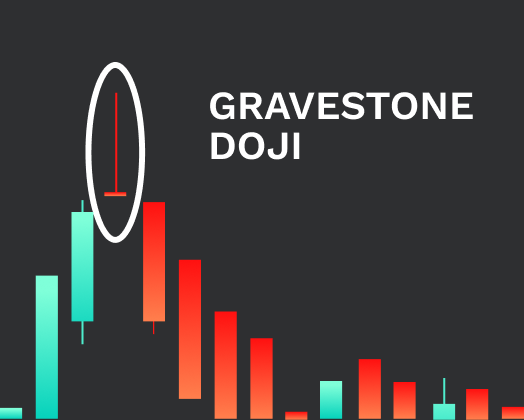
In some instances, the gravestone doji candles were signaling the soon-to-happen downfall after the continuous uptrend. The gravestone doji takes place when the bulls fail to outweigh bears, and the price cannot break out. After this doji candle, the price can go down considerably. So the gravestone doji can be used as a bearish reversal signal. It’s understood that, like any other indicator, it should be used alongside other signals. Every assumption should be confirmed by other market analysis tools. Relying on a single indicator is pretty reckless and risky.
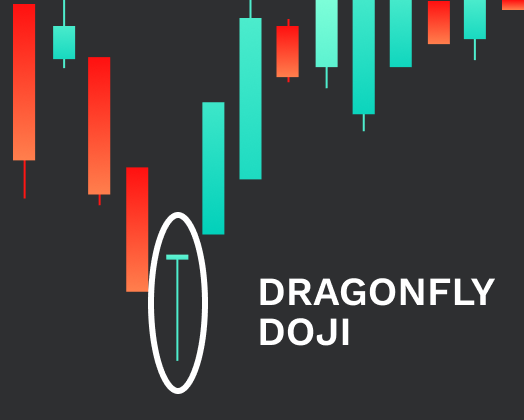
The dragonfly doji candle has an inverted shape of the gravestone doji pattern, and the meaning of this pattern can be opposite. The dragonfly doji is a bullish trend reversal indicator when occurring in a downtrend. Bears cannot take the price lower, and it’s an opportunity for bulls to propel the price to a new support level and start a long-term uptrend. However, in the uptrend, the dragonfly doji can be a bearish signal.
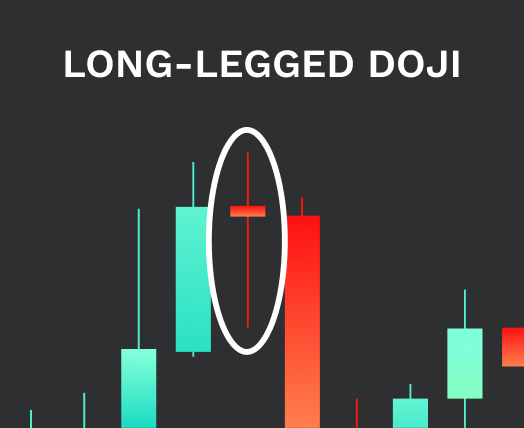
The long-legged doji is a candlestick where the open and close prices are the same, and they occupy the position at the middle of the wick between the high and low prices of the session. This type of doji pattern is probably indefinite. Usually, it’s a product of market indecision. Also, the long-legged doji can occur in the consolidation period.
Doji Candle vs. Hammer Candle
The dragonfly pattern resembles the hammer pattern. These signals are almost the same. Unlike the dragonfly doji pattern, the hammer pattern has a body. The former is usually seen as a more definite and reliable indicator than the hammer candlestick.
How to Trade with Doji Candlestick?
A gravestone doji is a bearish signal. It means that if other bearish indicators confirm that a trend reversal is about to occur, it’s time to take profit. Otherwise, you risk losing profits and selling an asset at a lower price.
The dragonfly doji occurring in the downtrend can signal a bullish trend reversal. It’s essential to confirm this assumption using other indicators before you take action. If other indicators confirm this prediction, then it’s a buying opportunity before the price begins to go up.
The bearish dragonfly doji takes place in the uptrend. If the price of the next candle after doji continues to go down, you can take it as a confirmation sign — time to take profit.
If you see a long-legged doji, we can only advise you to wait or use other indicators to figure out where the price is heading to. This pattern itself won’t tell you that much.
The Risks of Using Doji Candlestick
Like other patterns, the doji candlestick pattern has its flaws. None of the patterns is absolutely accurate and reliable. The doji candlestick is a rare pattern, and it can be too uncertain — especially if we deal with the long-legged doji candlestick.
The doji pattern can signal you in the wrong direction. That’s why checking every signal using a diverse set of indicators is crucial. It’s better to avoid investing before you confirm your hypothesis with several indicators.
The doji pattern can be very misleading on a short distance. As a simple one-candle pattern, it can occur quite accidentally. What it signals can end up being a false flag. That’s another reason to use more indicators.
Another usual setback that can take place with the doji pattern is that in a downtrend, it can signal a trend reversal, but the trend may continue instead.
Conclusion
As you might have noticed, we have observed three patterns instead of one. The doji candlestick patterns differ depending on the type and the current trend. What they have in common is that they are simple in structure, easy to spot, and not consistently accurate. They are still applicable, but combining the doji patterns with several other signals is always better.
Hopefully, you learned something meaningful about the doji candlestick, and it will help you in trading. Soon we’ll come back with more patterns!
Related


Stay tuned
Subscribe for weekly updates from our blog. Promise you will not get emails any more often.
Our authors

Most Popular
New Posts
Stay tuned
Subscribe for weekly updates from our blog. Promise you will not get emails any more often.
Our authors


