
For years, we’ve been introducing traders to candlestick patterns that aid in identifying upcoming market events, such as trend reversals, continuations, or consolidations. This article presents a vital selection of the most crucial chart patterns.
Our comprehensive guide to trading chart patterns covers both bullish and bearish patterns, conveniently categorized as triangle chart patterns, rectangle chart patterns, pole chart patterns, and exotic chart patterns. Keep this big book of chart patterns handy; it will always assist you in your trading endeavors.
TRIANGLE CHART PATTERNS
Triangle chart patterns are a cluster of candlestick patterns bearing a shape resembling a triangle. These triangles occur when two trend lines converge, marking the cessation of the existing market trend and the onset of a phase of indecision or a new trend opposite to the prior one.
Even if a triangle pattern you identify is deemed a continuation pattern, it’s prudent to verify for breakouts before deciding when to enter or exit your position. All triangle patterns are further classified as ascending, descending, or symmetrical.
Ascending Triangle
An ascending triangle represents a bullish reversal pattern observed in a downtrend, signaling an imminent breakthrough of the upper trend line. This pattern entails a horizontal resistance level, indicating consistently equal and steadfast highs, coupled with a steadily rising support level, reflecting progressively higher lows.
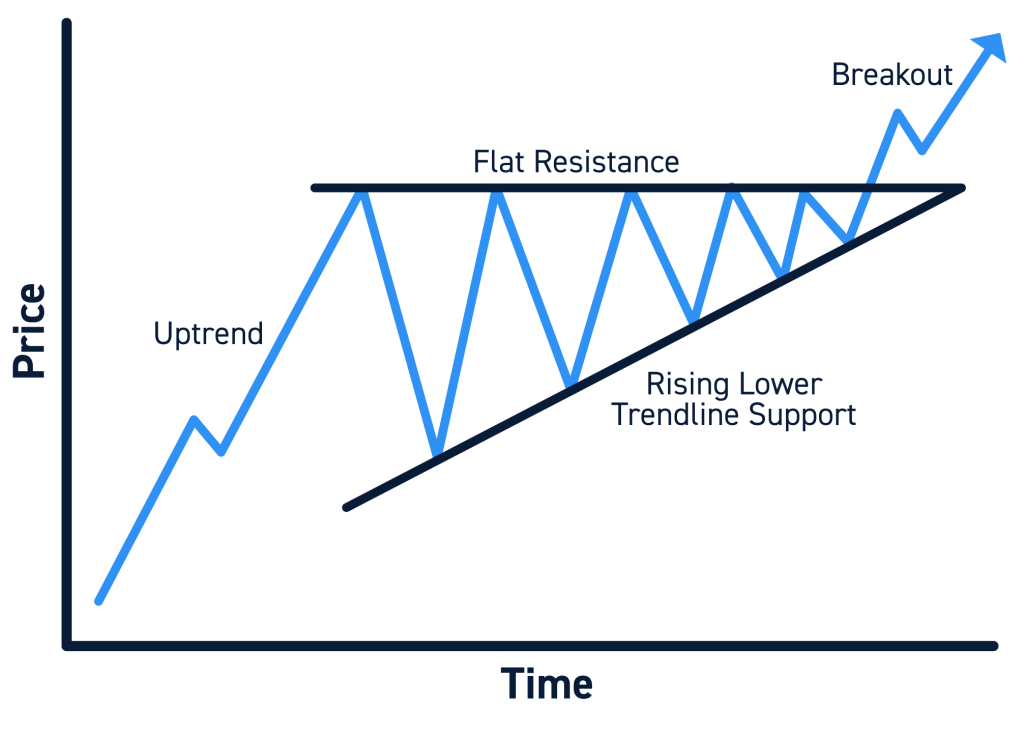
Image source: CenterPoint Securities
This configuration signifies an increase in buyer demand. Subsequently, the bulls begin purchasing at prices above the resistance line, which eventually transforms into a new support line as the uptrend unfolds.
Descending Triangle
Conversely, this pattern occurs in an uptrend and predicts a reversal to a bear market. Within this setup, the lower trend line (or support line) remains horizontal, while the highs steadily decline, forming a diagonal downward line. At a certain point, the upper trend line intersects the support line, leading to a price breakdown and the initiation of a bear market phase. The support line transitions into a resistance line.
Bullish Symmetrical Triangle
Symmetrical triangles typically indicate a trend continuation. A bullish symmetrical triangle emerges during an uptrend, comprising two converging trend lines progressing at the same pace. This occurs due to the gradual decrease in highs and the gradual increase in lows.
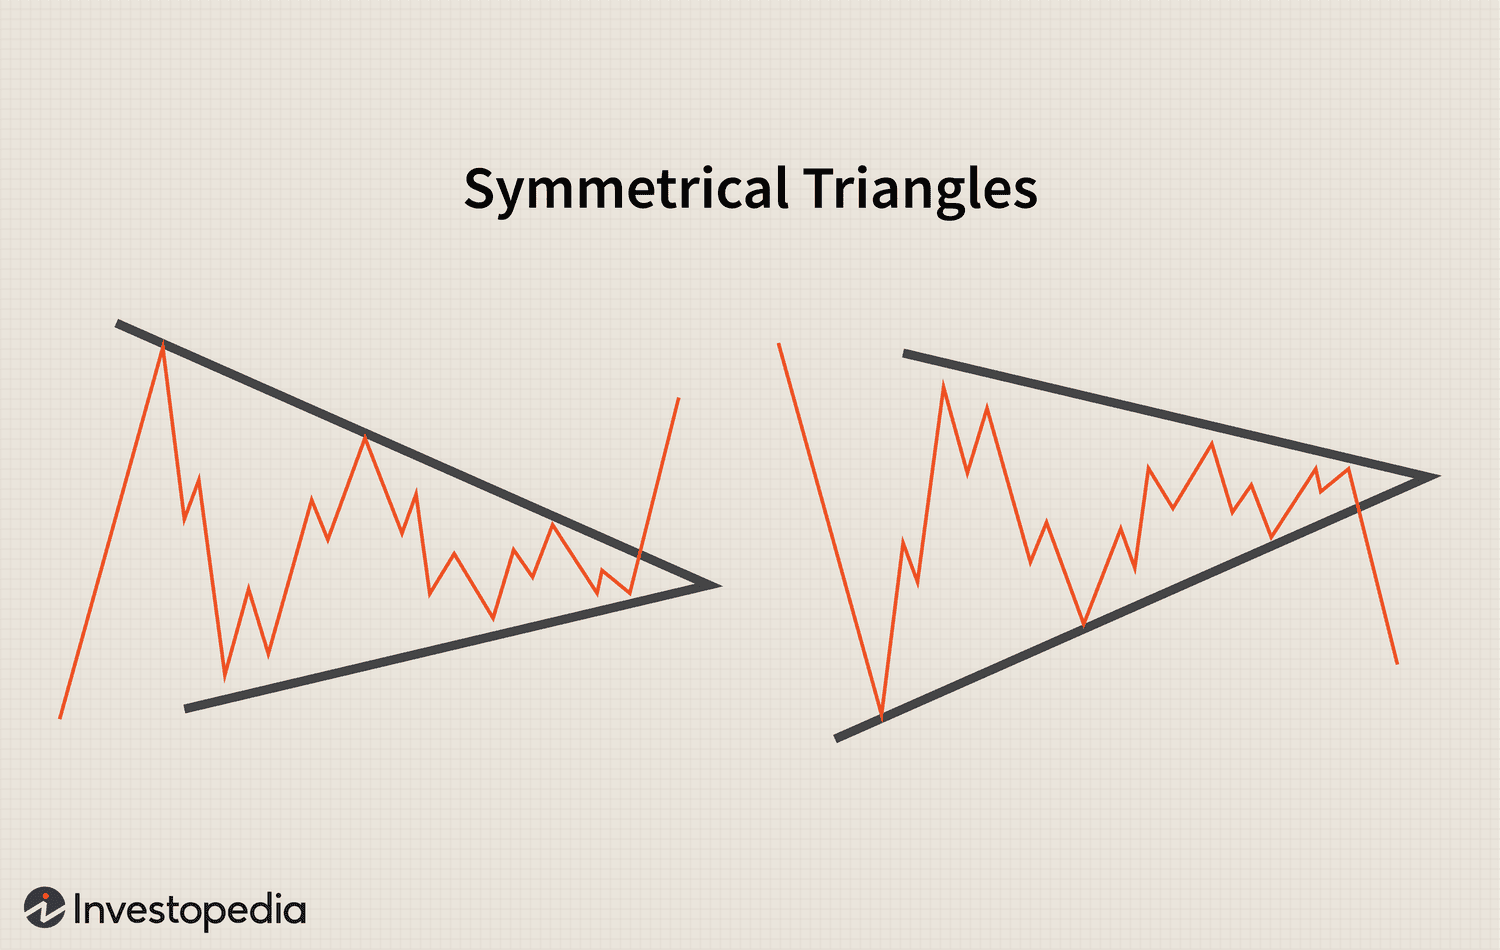
Image source: Investopedia
As trading volume rises, the lines intersect, leading to a price breakout and the attainment of new highs.
Bearish Symmetrical Triangle
The bearish symmetrical triangle materializes within a downtrend, signifying market indecision as highs diminish while lows increase.
With an escalation in trading volume, the trend lines intersect, resulting in a price breakdown.
Rising Wedge
Although wedge patterns may resemble triangle patterns, there are critical distinctions to note. In a wedge, the trend lines do not intersect, and the price breaks out or down before the lines intersect. Another noteworthy aspect is that both trend lines are either rising or falling. Converging trend lines coupled with declining trading volume provide a reliable signal of an impending trend reversal.
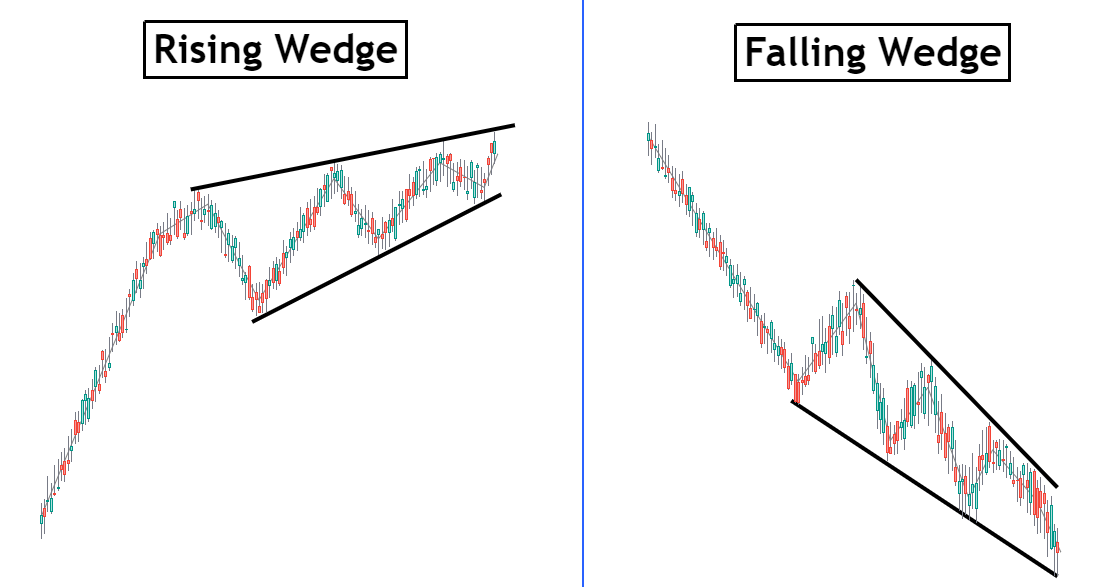
Image source: Bybit Learn
When the trend lines are ascending and the trading volume declines, it signifies a rising wedge, which serves as a bearish signal. The price undergoes a breakdown after reaching a peak point at low volume.
Falling Wedge
The falling wedge is distinguished by converging downward trend lines accompanied by diminishing trading volume.
Both lows and highs decrease. This pattern typically (but not always) occurs during a downtrend. Eventually, the bulls engage in more active buying, propelling the price upwards owing to low trading volume.
RECTANGLE CHART PATTERNS
Repeatedly, price fluctuations within rectangle patterns reach consistent highs and lows, characterizing these patterns with robust support and resistance lines. These lines are horizontal and parallel, forming a rectangular shape. Some traders await breakouts, while others buy at the support price or sell at the resistance price. Rectangle patterns are often regarded as consolidation or indecision patterns, although some interpret them as bullish and bearish signals.
Bullish Rectangle
A bullish rectangle surfaces within an uptrend following a consolidation phase. If the price breaks out, it’s prudent to place a long order, as it is likely to grow in size, potentially by the height of the rectangle. Identifying the pattern before the price breaks allows for opening a long position close to the support level, maximizing potential profits. However, this strategy carries inherent risk.
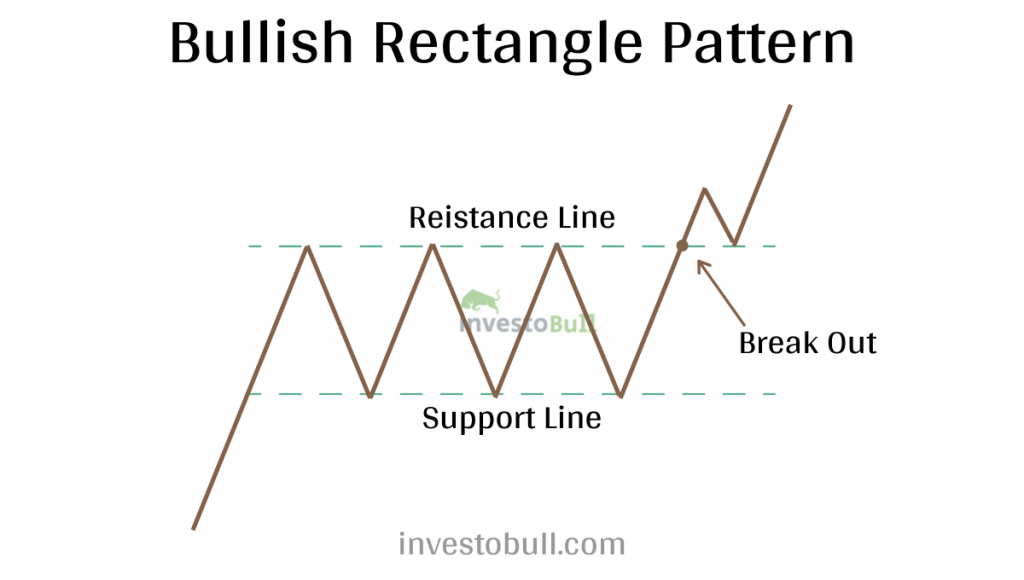
Image source: Investobull
Additionally, trading opportunities exist within the rectangle, allowing shorting at the resistance line and buying at the support level.
Bearish Rectangle
A bearish rectangle manifests following a consolidation phase in a downtrend. This pattern suggests that we can place a short order at the support level price, as post-consolidation, it typically drops below – often decreasing by an amount close to the interval between the trend lines during the consolidation period.
Double Top
The double top pattern resembles a bearish rectangle pattern, resembling the letter “M.” This pattern materializes during an uptrend. As the price reaches the support line for the third time (the last point of the “M” letter), it breaks down, signifying a trend reversal to a bear market.

Image source: TradingView
Double Bottom
The double bottom pattern represents a bullish rectangle W-shaped pattern. As the double bottom is an inverted version of the double top pattern, its meaning is the opposite. It occurs in a downtrend, and the price breaks out as the “W” shape forms.
Triple Top
A triple top pattern is an elongated version of the double top pattern and shares a bearish nature. It consists of three peaks with troughs between them. Once the pattern forms, the price experiences a downward break.
Triple Bottom
A triple bottom pattern is an elongated version of the double bottom pattern and presents a bullish pattern. It touches the support level at three points and experiences pullbacks in between. Upon completion of the formation, the price undergoes a breakout.
POLE CHART PATTERNS
Pole patterns bear a resemblance to flags and pennants, featuring a pole section and the flag/pennant section.
Bullish Flag
A bullish flag represents a robust continuation pattern unfolding during an uptrend. It commences with a ‘pole,’ a sharp vertical ascent following a consolidation phase. The subsequent ‘flag’ portion typically displays a horizontal rectangular shape or tilts slightly downwards.
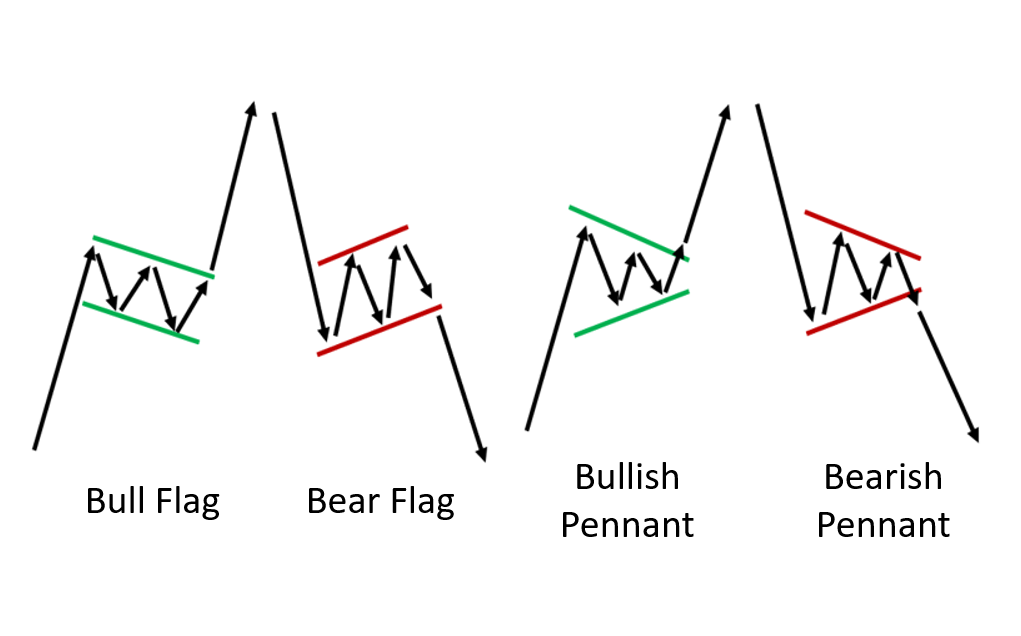
Image source: Synapse Trading
As the pattern takes shape, the price often surges, frequently matching the size of the flagpole.
Bearish Flag
A bearish flag mirrors an inverted bullish flag and is discernible during a downtrend. It commences with a downward ‘pole’ – a pronounced price decline. This is succeeded by a ‘flag’ portion, usually showcasing a rectangular pattern with well-defined trend lines. The flag is typically horizontal, sometimes exhibiting a slight upward drift. When the pattern materializes, the price swiftly descends, usually to a size akin to the pole’s decline.
Bullish Pennant
The bullish pennant closely resembles the bullish flag, except for the ‘flag’ (‘pennant’) portion, which assumes a symmetrical triangle shape.
Bearish Pennant
The bearish pennant is a mirrored version of a bullish pennant and has an opposite meaning as it signals the reverse to a bear market.
EXOTIC CHART PATTERNS
Exotic patterns are unusual patterns that do not fit into the previously mentioned categories.
Head & Shoulders
The head and shoulders pattern materializes during an uptrend, indicating an impending price reversal.
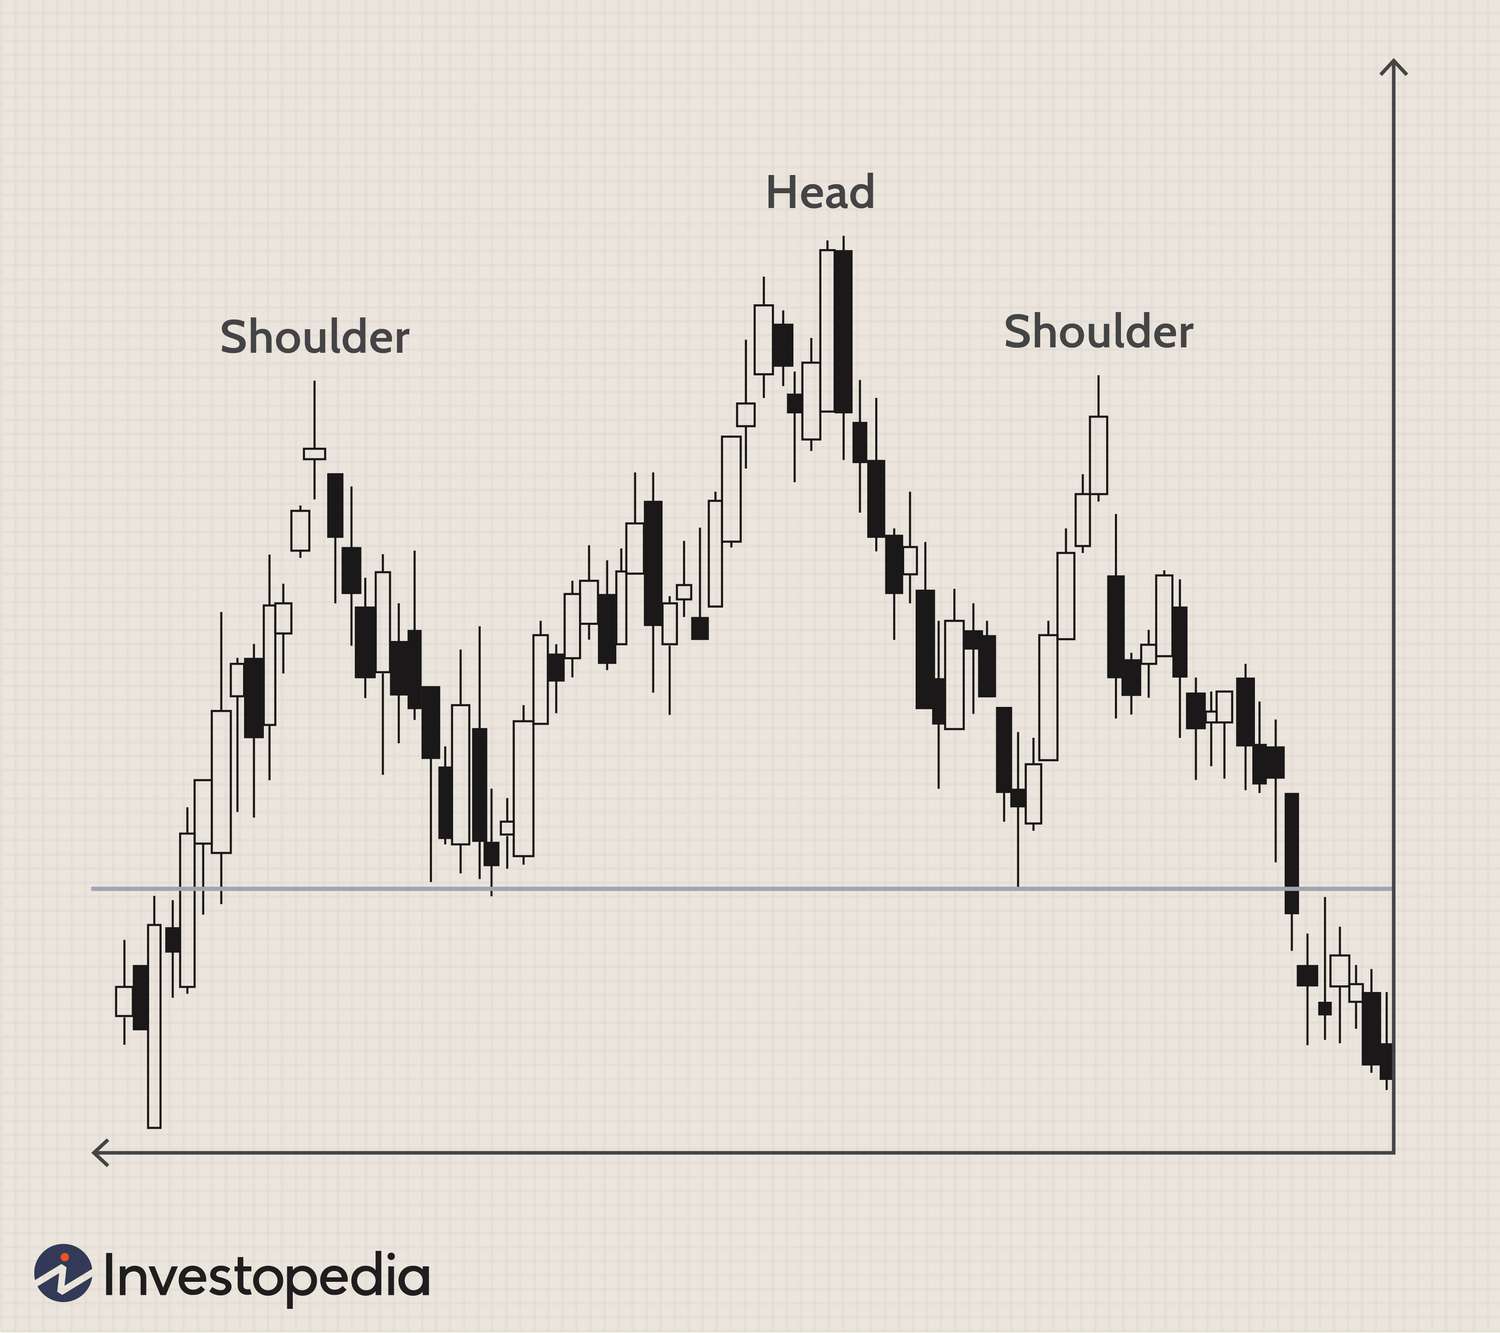
Image source: Investopedia
It comprises three peaks – with the middle peak (head) being the highest. The peaks on both the right and left (shoulders) display roughly equal height and are lower than the head. The troughs between the head and each shoulder are nearly identical, forming a baseline. This baseline is higher than the trough at the formation’s outset and at the pattern’s conclusion, after which the price undergoes a breakdown.
Inverted Head & Shoulders
The inverted version serves as a robust bullish signal. Instead of three peaks, it features three troughs. The middle trough acts as the head (the lowest price). The right and left troughs (shoulders) are not as low as the head. The shoulders align at the same level, constituting a baseline. As the second shoulder develops, the price breaks through the resistance line, prompting a market reversal and rally.
Both types of head and shoulders – bullish and bearish – are considered highly reliable patterns.
Cup & Handle
The cup and handle pattern represents a bullish signal.
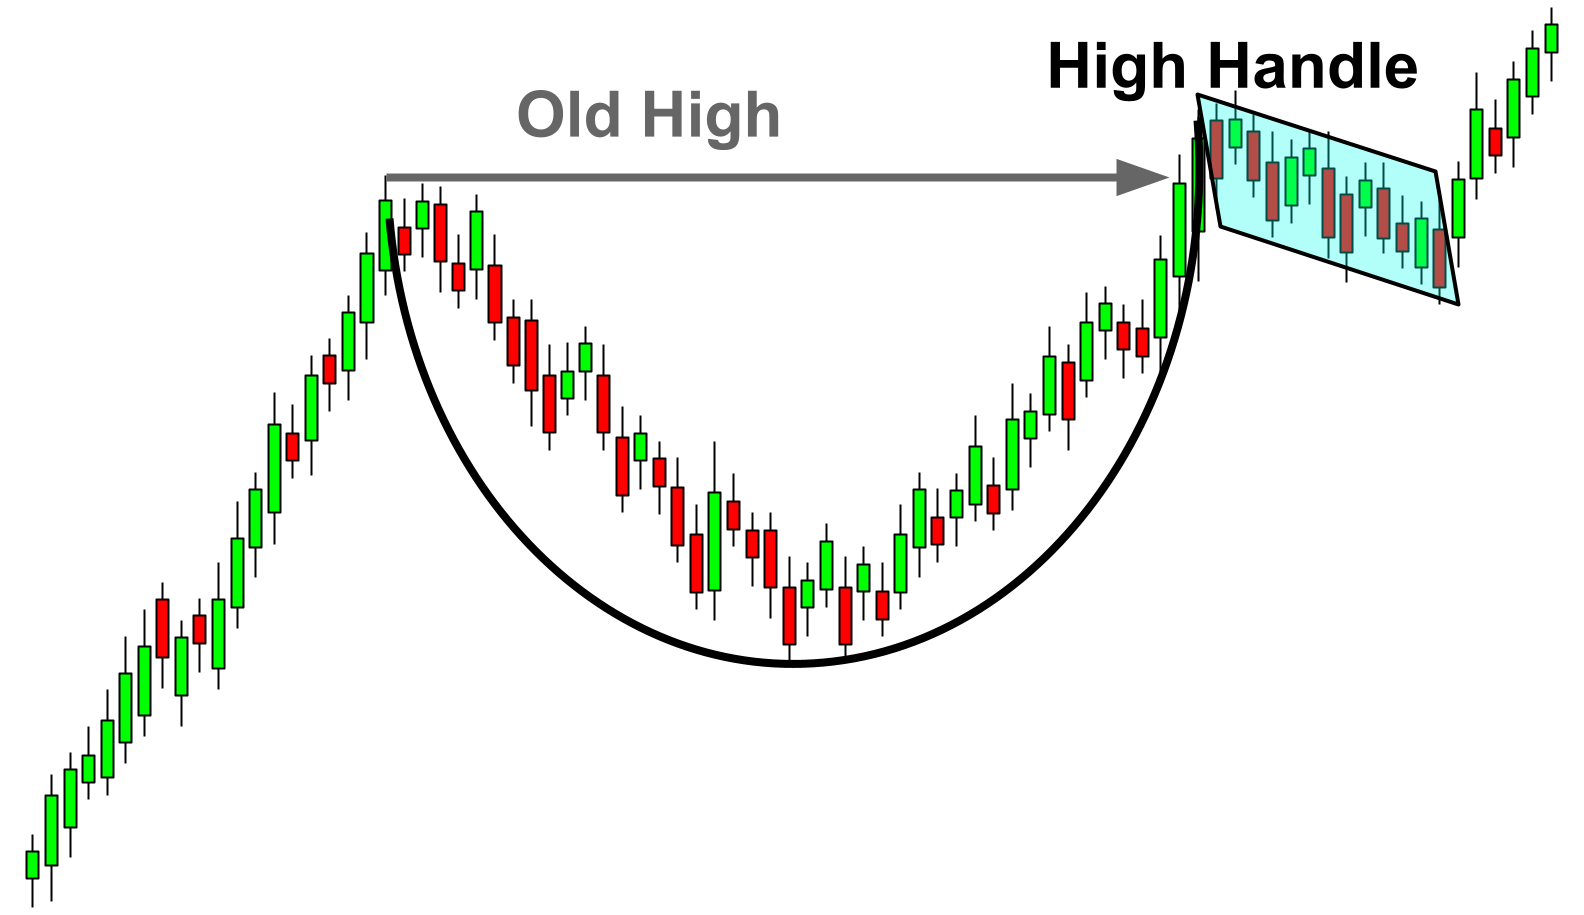
Image source: Bybit Learn
The pattern encompasses several components – two peaks and the trough between them form the ‘cup,’ followed by a downward price movement bordered by parallel trend lines, known as the ‘handle.’ As the price approaches the midpoint of the cup’s height, it breaks out, commencing a robust rally.
Inverted Cup & Handle
The inverted cup and handle pattern serves as a bearish signal. The cup’s bottom represents the peak, while the sides serve as the troughs. The handle points upwards, and when the handle formation is complete, the price undergoes a breakdown.
Final Thoughts
As illustrated, chart patterns exhibit diversity and significance. Many of them feature both bearish and bullish versions. None of the patterns provide a 100% guarantee that the price will behave as predicted by the pattern. Each carries a risk-to-profit ratio. Nonetheless, when used cautiously, they can be effective. Hopefully, this concise guide will prove to be helpful and practical.
Related


Stay tuned
Subscribe for weekly updates from our blog. Promise you will not get emails any more often.
Our authors

Most Popular
New Posts
Stay tuned
Subscribe for weekly updates from our blog. Promise you will not get emails any more often.
Our authors


