
Candlestick patterns serve as valuable tools for experienced traders, allowing them to anticipate potential market movements, such as trend reversals or continuations. Many bear names that illustrate their visual resemblance to various objects. This gives rise to patterns such as “three white soldiers,” “head and shoulders,” or “hammer.” The very term “candlestick” in trading owes its name to its likeness to an actual candle. In a way, these patterns resemble constellations like the Big Dipper or Leo.
This article focuses on the Cup and Handle pattern. In its typical form, this pattern emerges within an uptrend, signaling an impending correction followed by a resumption of the trend. Conversely, the inverted cup and handle presents an opposite signal. In either case, the pattern offers clear entry and exit points. However, it is worth noting that the pattern is relatively complex and can be challenging to identify and interpret correctly. The article delves into the definition of the cup and handle pattern, provides insights into trading it, offers an example of the pattern in action, and analyzes the reverse cup and handle pattern, among other aspects.
What is the Cup and Handle Pattern?
The cup and handle pattern is perceived by some as a bullish pattern, while others regard it as a consolidation pattern. At its core, the pattern manifests within an uptrend. The “cup” shape begins to form when the price declines, following which it retraces back to the level where the decline commenced. Subsequently, the “handle” materializes, representing a short-term pullback. Following this, the asset’s price resumes its upward trajectory, eventually surpassing the level at which the cup and handle pattern originated.
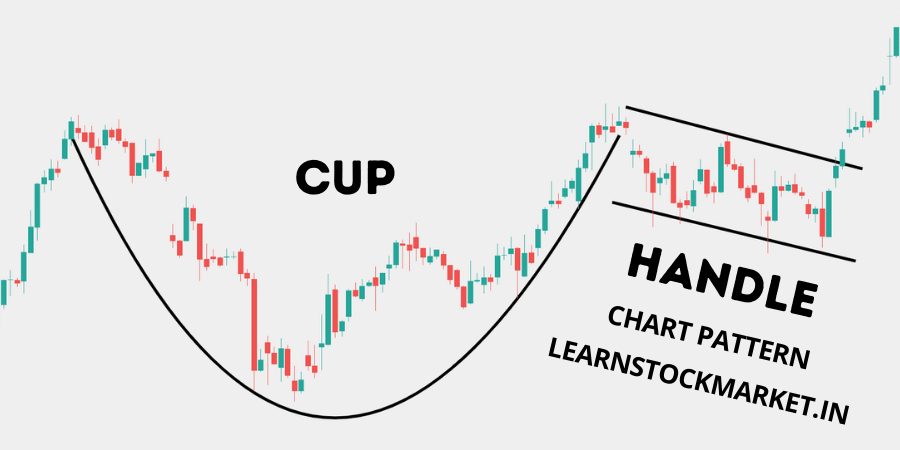
Image source: Learn Stock Market
This pattern is relatively common and was initially popular among stock market traders, but has now also become prevalent in crypto trading. It can be observed across various timeframes, whether spanning an hourly timeframe or several months. The most common approach for working with a cup and handle pattern involves utilizing the 24-hour chart.
The Cup and Handle Pattern Structure
This pattern typically materializes following a bull run, marked by a decline in bullish momentum. To confirm the cup and handle pattern accurately, one should identify five key elements, after which the price breaks out and advances beyond its previous level.
Bullish cup and handle pattern
The components of the pattern are outlined below:
1. A substantial rally preceding the pattern’s formation is a prerequisite for the cup and handle pattern to emerge.
2. The rally is succeeded by a pullback.
3. Rebound to a level approximately around position 1.
4. The subsequent price movement is downward.
5. Trading volume surges around point 3 and diminishes around point 4.
The scenario unfolds as follows: the price experiences a rapid ascent, followed by a correction leading to a price decline. The left part of the cup takes shape during this period of descent. Following a retracement of 30 to 50%, the price rebounds from the bottom, initiating an upward trend and forming the right part of the cup. Typically, this surge halts near the level of the previous high.
The elevated price prompts the bulls to cease buying, as they prefer to adopt a cautious stance. Few of them are inclined to sell. At this juncture, the bullish momentum decelerates, paving the way for another correction. However, as there are few sellers this time, the correction is relatively brief and superficial, forming a handle. On occasion, the handle may develop at a level higher than the preceding peak point. Once the selling pressure subsides, the price commences its ascent. When the price surpasses the level at the beginning of the handle, the pattern is confirmed.
Inverse (or Bearish) Cup and Handle Pattern
The inverted cup and handle pattern represents the converse of the regular pattern. Unfolding within a bear market, it signifies a bearish continuation pattern. Despite the cup being inverted upside down, the handle still materializes towards the right of the cup eventually.
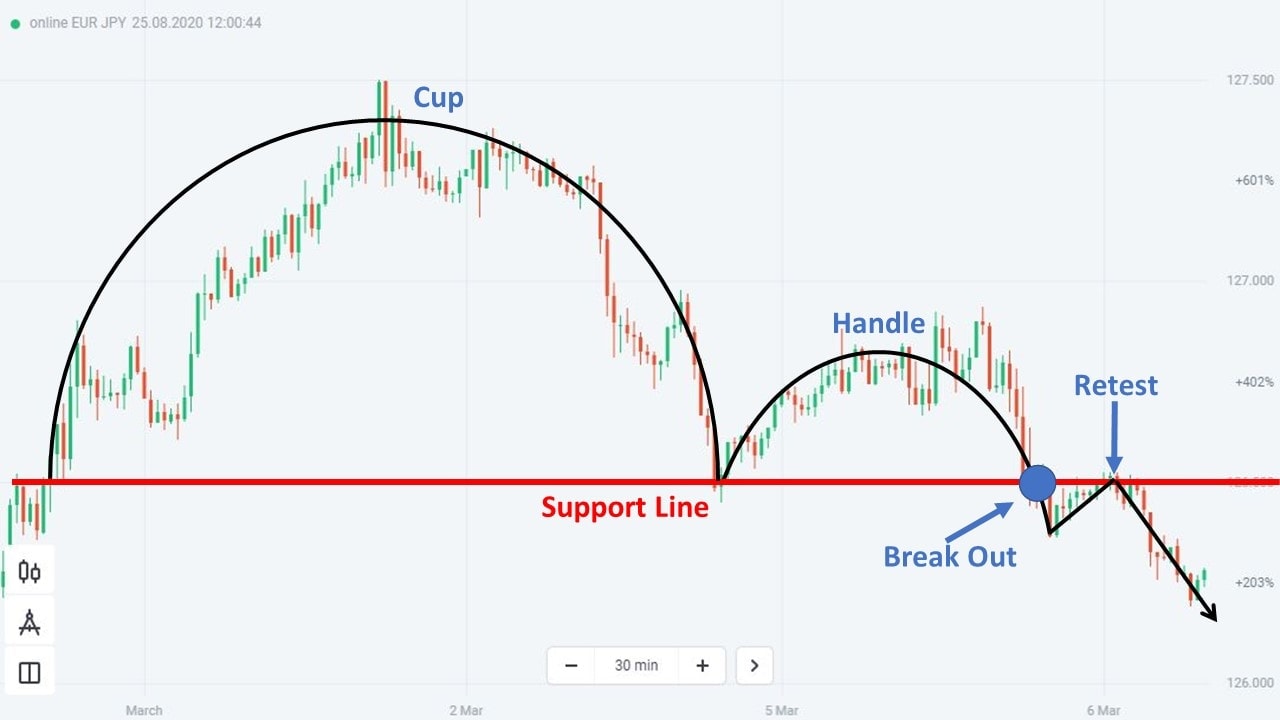
Image source: How to Trade Blog
The pattern is confirmed when trading volume diminishes during the handle phase, and the price swiftly descends as the handle encounters the resistance line.
Cup And Handle Pattern Failure
Occasionally, a cup and handle pattern may materialize but fail to culminate as expected. The handle phase may linger, and the price continues its downward trajectory. This scenario is termed a “failed cup and handle pattern.” It signals a reversal in trend, indicating the shift to a bear market.
Double Cup And Handle Pattern
The double cup and handle pattern essentially represents the double top and double bottom patterns, which are two distinct patterns. The double top pattern presents an “M” shape, conveying a bearish signal. Conversely, the double bottom pattern, denoted by its W-shaped structure, serves as a bullish signal.
In the double top pattern, the price declines after reaching the resistance level for the second time. In contrast, in the double bottom pattern, the price rises after hitting the support line for the second time.
How to Trade the Cup and Handle Pattern?
The cup takes on a triangular appearance. The safest entry point is when the handle forms and the price ascends. Confirmation occurs when the price surpasses the highest point of the handle. Nonetheless, even in this scenario, the price may drop suddenly. Hence, it is advisable to utilize a stop-loss to mitigate risk.
Set a Stop-loss with The Cup and Handle Pattern
Mitigating risk involves using a stop-loss order. For instance; if the cup forms between $10 and $14, the stop-loss is placed above $12, exceeding the midpoint of the cup. To minimize risks and optimize the risk-reward ratio, experienced traders position stop-loss orders within the upper third segment of the cup.
Set an Exit Strategy with The Cup and Handle Pattern
When setting target prices, it is advisable to position them above the handle breakout level. For instance, if the cup’s extremes range between $10 and $14, the target price should be set above $14. Importantly, the left and right sides of the cup cannot be identical. In such instances, it is recommended to utilize the shorter side as a reference point and place the target price above it. Although there is a higher risk, positioning the price higher can potentially yield greater returns.
Cup And Handle Pattern Success Rate
To enhance the likelihood of success when utilizing the cup and handle pattern, you should remember the following:
- A shorter handle often corresponds to a higher success rate.
- In the event that the cup and handle pattern is identified on a smaller timeframe (e.g., a 15-minute frame or smaller), it’s crucial to assess the broader context on a larger timeframe before taking action. Utilizing a 24-hour timeframe may suffice. Notably, if the pattern manifests on a 15-minute timeframe chart but the 24-hour timeframe chart indicates a bear market, it is wise not to trade based on the assumption of a cup and handle pattern.
Pros and Cons of a Cup and Handle Pattern
Every pattern has its strengths and weaknesses. Below are the advantages and tradeoffs associated with the cup and handle pattern:
Pros
- A common pattern, well-recognized among experienced traders.
- Clearly defines the entry, stop, and limit points. Once the pattern is confirmed, the subsequent steps become more evident.
- Applicable across different time frames, offering versatility in trading strategies.
Cons
- Novices may encounter challenges in accurately identifying this pattern, potentially leading to misinterpretation and trading errors.
- The formation of the cup and handle pattern can be a time-consuming process, requiring patience and vigilance throughout its development.
Related


Stay tuned
Subscribe for weekly updates from our blog. Promise you will not get emails any more often.
Our authors

Most Popular
New Posts
Stay tuned
Subscribe for weekly updates from our blog. Promise you will not get emails any more often.
Our authors


