
All tech indicators have limitations. We constantly repeat that you should always combine several market signals to prevent costly mistakes. We are not going to backpedal on this, but today we will speak about a tech indicator considered one of the most precise. Of course, this chart pattern can be misleading, too, but in most cases, it accurately predicts the soon change of the trend from bullish to bearish. We are speaking about the chart pattern called head and shoulders.
The head and shoulders pattern is a chart formation that consists of three peaks, with the middle peak being the highest and the two outer peaks being lower in height. The central peak is known as the head, while the two outer peaks are referred to as the shoulders. The pattern resembles a person’s head and shoulders, hence the name.
Like any stock market tech indicator, this pattern very well applies to the cryptocurrency market. The specifics of the crypto market don’t critically impact the way we use trading signals. In this article, we will give a head and shoulders pattern definition, name its characteristics, mention an inverse head and shoulders pattern, see how to use this indicator on the crypto market, etc. At best, you will learn everything you need to use this pattern when you trade crypto.
What Is the Head and Shoulders Chart Pattern?
In tech analysis, head and shoulders is a chart pattern appearing at the end of the uptrend and signaling the soon trend reversal. The head and shoulders pattern is a baseline that has three peaks. The central one (“head”) is much higher than the rest. The left and right peaks are on about the same level.
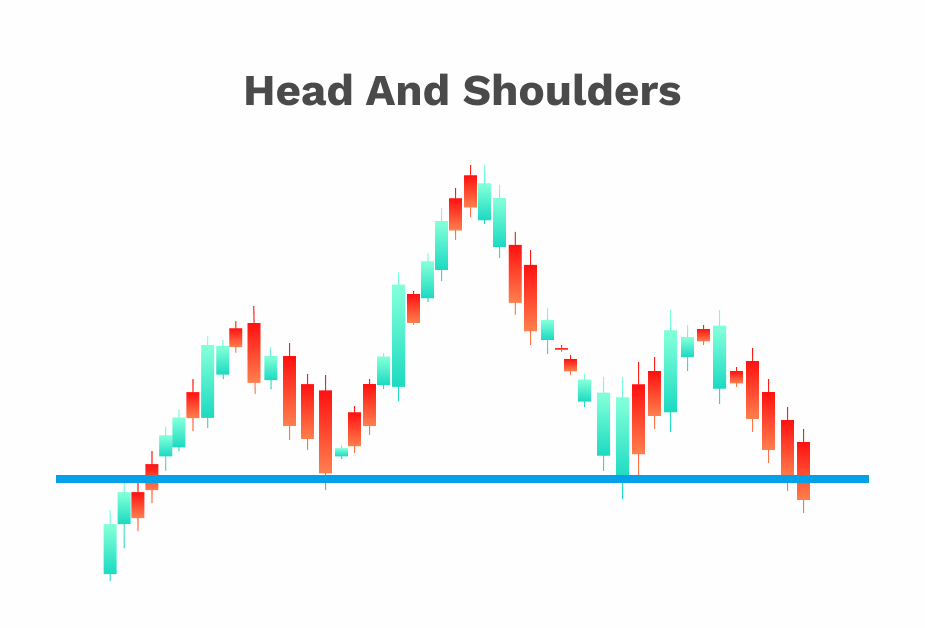
The formation reflects the struggle of bulls to push the price to new heights. The first peak tells us that the spike was short, and the price returned to the same level after a momentary breakthrough. The second peak (“head”) is the highest one. But soon after reaching this level, the price bounces back again — to about the same level it had after the first peak. It means bears won’t let the price take-off apart from short spikes.
The final peak in the formation resembles the first one. Bulls cannot repeat the success of the previous peak, and the price gets ready to go down. The downtrend is about to begin. Another term in the head and shoulders pattern is the neckline, a line that connects the troughs of the pattern.
What Is the Inverse Head and Shoulders Pattern?
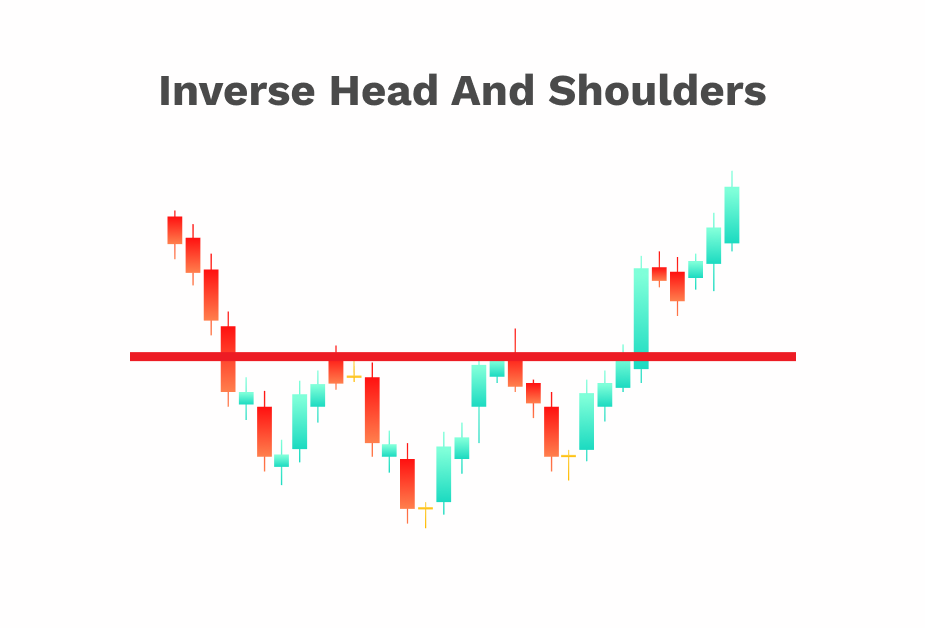
Like many other trading patterns, a head and shoulders pattern has an opposite pattern. The opposite signal is called the inverse head and shoulders pattern. Unlike head and shoulders, it is a bullish indicator. The neckline in this pattern coincides with the resistance level.
The structure is almost the same, but the pattern is reflected horizontally. It has three troughs. The second (central) trough is the lowest one. This pattern takes place in a downtrend and signals a trend reversal to an uptrend. With some reservations, we can call this signal a bullish head and shoulders pattern.
The reverse head and shoulders pattern has a reputation as strong as its bearish twin’s one. Both indicators are reliable and precise. Of course, no precision can be absolute if we speak about predicting the future state of the market as many factors impact the prices, sometimes in an unpredictable manner.
Characteristics of the Head and Shoulders Pattern
Now, let’s observe the main characteristics of the head and shoulders pattern.
- This pattern is a bearish trend reversal signal, while the inverse head and shoulders pattern is bullish.
- The neckline is the level at which bears start to overcome bulls, and the selling trend starts to dominate.
- The downtrend unleashes when the right shoulder level gets broken.
- Head and shoulders is a reliable indicator. Many experts and traders trust this pattern more than other trend reversal signals.
How To Trade Crypto With the Head and Shoulders Pattern?
The head and shoulders pattern is absolutely applicable to the crypto market with no reservations. Two factors make using this pattern for crypto slightly different from using it for traditional assets. First, cryptocurrency is more volatile, so that the price movements can be fiercer and the neckline bumpier. Second, the crypto market is active 24/7, so the formation can keep on developing even when you sleep.
There are some preferred strategies for trading the head and shoulders pattern. First, it’s better to spot a neckline because it serves as a confirmation of the signal. The break below the neckline is the time to take action. The trading volume tends to increase in the break section.
One of the popular ways is to post a stop order at the breakout of the neckline at the highest or the lowest point of the right shoulder. You should set the target at a level equal to the difference between the high and low points. Then, you should add (if you post an order at the peak) or subtract (if you post it at the bottom) what you got from the breakout price.
Apart from trading the break below the point, many traders prefer pullback trading. This strategy is more demanding in terms of self-discipline but rewards successful traders more generously. For pullback trading, you should post a short order when the price retraces after the break below.
If you are interested in trading the bullish head and shoulders pattern (inverse), remember that it forms at the end of the downtrend. In the case of an inverse head and shoulders pattern, the neckline is drawn by connecting the two peak points between the left shoulder and the head and between the head and the right shoulder. You can post buy stop-loss orders below the right shoulder as soon as you confirm these points. That’s a proper time to enter the market.
We want to remind you that you should always combine the patterns you use with other indicators for higher precision in your analysis. Even such a reliable pattern as head and shoulders works better with the support of moving averages, stochastic oscillators, etc.
Pros & Cons
No indicator is perfect, and the head and shoulders pattern isn’t flawless either. In this chapter, we will observe the pros and cons of this indicator. Let’s start with the pros and then name the shortcomings of the pattern.
Pros
- Seasoned traders recognize this pattern quickly. For those who have spent some time behind the charts and graphs, head and shoulders is one of the easier patterns to spot.
- Predictable levels of risk and profitability. You can count what you will get or lose from trading head and shoulders. By rare chance, these calculations, if made correctly, can turn out to be a mistake.
- A long duration of the pattern. You can enter the market without needing to hurry. The market makes several changes during the pattern, and you can profit from them.
Cons
- Spotting the head and shoulders pattern can be challenging for newbies. One of the pitfalls of the pattern is that, at times, the neckline is not that flat, so inexperienced traders don’t recognize the pattern because of that.
- Stop loss distance might be too long. It doesn’t happen all the time with head and shoulders, but you should be prepared.
Bottom Line
The head and shoulders pattern is a powerful technical analysis tool that can help traders identify potential trend reversals in crypto markets. Traders should always confirm the pattern with other indicators and wait for breakout confirmation before taking positions. The head and shoulders pattern can be used in conjunction with other trading strategies to increase profitability and reduce risk.
Related


Stay tuned
Subscribe for weekly updates from our blog. Promise you will not get emails any more often.
Our authors

Most Popular
New Posts
Stay tuned
Subscribe for weekly updates from our blog. Promise you will not get emails any more often.
Our authors


