

Many cryptocurrency owners participate in trading. Therefore, we strive to provide you with educational pieces on trading. To date, we have written many articles on market signals, such as the three white soldiers, harami candles, evening star, and loads of others.
This time, we are going to introduce two trend reversal patterns. A bullish one is called the triple bottom pattern. A bearish one is known as the triple top pattern. As you might have guessed, these patterns have similar characteristics and kind of reflect each other. From the article, you will learn how to spot these patterns, what they indicate, how to trade using triple bottom and triple top, etc.
What Is the Triple Bottom Pattern?
A triple bottom pattern is a bullish market signal formed by the sections on the chart in which the price gets the same low level three times in a row. The pattern takes place in a strong downtrend. The last bottom is characterized by high volume.
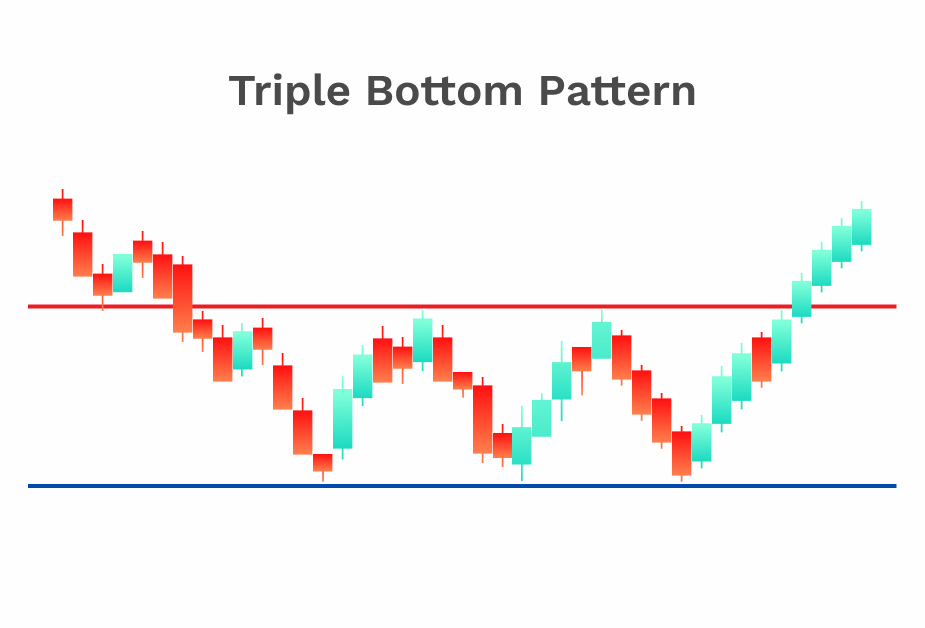
These three bottoms indicate that the price fails to go below, even when the trading volume rises. The selling pressure gets weak, and usually, the pattern is followed by a trend reversal. After the first and the second time, when the price reaches the support level, it rises and gets the same maximum both times before going down. After the third bottom, the price is expected to go up.
What Is the Triple Top Pattern?
A triple top pattern is a bearish market signal conceived of three peaks of the same price in a row on the graph. The two lows between the three peaks are at the same level, too. If these peaks appear at the end of the uptrend and a considerable volume characterizes the last peak, you are likely dealing with a triple top pattern.
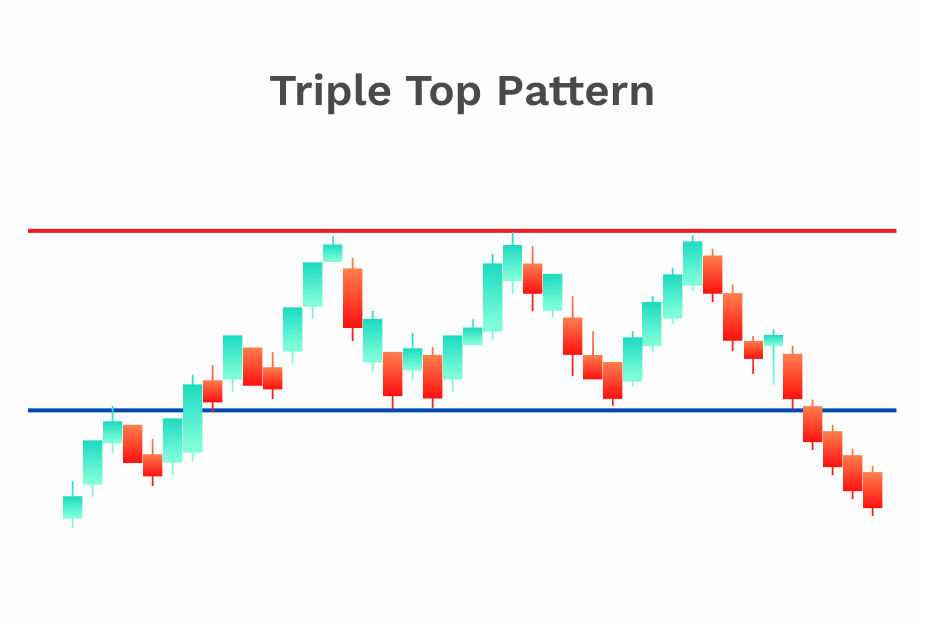
The peaks are on the same level despite the increasing trading volume, therefore, the buying pressure loses dominance. After vain attempts to break through the resistance level, the price goes down.
How to Spot Triple Top and Bottom Patterns on a Crypto Chart
Spotting these patterns correctly is crucial. If you mistake a different pattern for the triple top or bottom, you can make wrong conclusions and make decisions that will bring losses instead of profits.
The triple top and triple bottom patterns are associated with support and resistance levels, and trading volume. The triple top pattern has three peaks at the resistance level. The latest of them is characterized by an increased trading volume indicating that buyers try hard but fail to break the resistance level. The low points you see between the peaks should be at the support level. The overall pattern takes place at the end of the uptrend. Only if it fits all the characteristics you can conclude that it is probably the triple top pattern.
The three pits touching the support line and two peaks between them at the resistance line signify a triple bottom pattern. If it takes place at the downtrend and the final bottom is associated with a high trading volume, you probably deal with a triple bottom pattern.
How to Trade with the Triple Top Pattern?
There are not many ways to react to these patterns adequately, as these patterns are relatively straightforward in terms of how you can interpret them. As triple top indicates a soon downtrend and triple bottom signals an upcoming price rise, you should act respectively. However, the first thing to do before you take any other action is to confirm these predictions using other indicators and patterns. If the upcoming trend reversal is confirmed by the likes of stochastic oscillators or other tools, it’s time to make money.
When you spot a triple top pattern, you can opt to sell the asset, hoping to repurchase it at a lower price. The price drop will likely happen right after the third peak. The right time to sell is when the price goes below the support level. The price hitting the support level for the third time signals it will continue to go down. The lesser the trading volume in the third top, the less the chance that the price will go down after hitting the support level. Therefore, you should always pay attention to trading volume when you see a chart pattern fitting into the triple top. Only if the volume is high in the last top you can expect a trend reversal soon.
How to Trade with the Triple Bottom Pattern?
As the triple bottom pattern signals the end of the downtrend and the change of the market sentiment to the bullish phase, the pattern’s end is the market entry point where you can buy an asset at a relatively low price before it surges. Ensure the last bottom has a high trading volume. If it’s not, the chance of trend reversal is not that big, and buying an asset can turn out to be a bad investment at that point.
So if you spot a triple bottom pattern, the time to buy is when the price breaks the resistance level after the third bottom. The pattern, if confirmed, indicates the upcoming price growth, so you can buy in, and rest assured you will be able to sell the asset at a higher price later. To confirm the upcoming uptrend, you should use other market analysis tools.
Limitations
To maximize profits while using these patterns, you should learn to spot them at the early stages so you will invest at the best moment. As the pattern’s formation is complete, you have already missed the best moment to invest. But if you invest before the building is complete, you risk it because the incomplete pattern doesn’t signal anything at all. That’s why it’s advised to invest when the pattern is complete, and you know what to expect from the market.
The limitation of the triple bottom and the triple top is that both these patterns are not easy to identify in the early phase. If you think you can, you risk making a grave mistake. As was mentioned above, when you identify the complete triple top/bottom pattern, it’s too late. You still can invest, but the best moment has passed behind.
And like any other indicator, triple top and triple bottom don’t give you a 100% correct result. Crypto (or even stock) markets can behave unexpectedly at times. To decrease risks, it’s always recommended to use a combination of several market indicators/tools.
Conclusion
The triple bottom and triple top chart patterns occur at the hottest points of the buyers vs. sellers tense battle. More accurately, one of the patterns occurs at the breaking point, when the sellers are losing their dominance and clearing the spot for buyers and vice versa. Usually, these patterns emerge after a long-lasting uptrend or downtrend.
The first section of the pattern can be a regular price move. The next section of the triple top/bottom pattern is a more graphic attempt of bears/bulls to get ready for the potential flip. The third section is a strong signal of the trend reversal. As mentioned before, it’s better to confirm it via other indicators.
Those who accidentally or intuitively open the proper position before the pattern’s formation is complete get the most profit. However, if you prefer to stay cool and be in control of your emotions and manage your risks, you should make sure the triple bottom/top pattern is here so you can open the correct position.
All in all, triple bottom and triple top charts are solid market signals. You won’t mistake them for something else as soon as they fully form. The most efficient way of using these indicators is being capable of identifying them as soon as they emerge and opening a proper position swiftly.
Related


Stay tuned
Subscribe for weekly updates from our blog. Promise you will not get emails any more often.
Our authors

Most Popular
New Posts
Stay tuned
Subscribe for weekly updates from our blog. Promise you will not get emails any more often.
Our authors


